31
31peptides
spectra
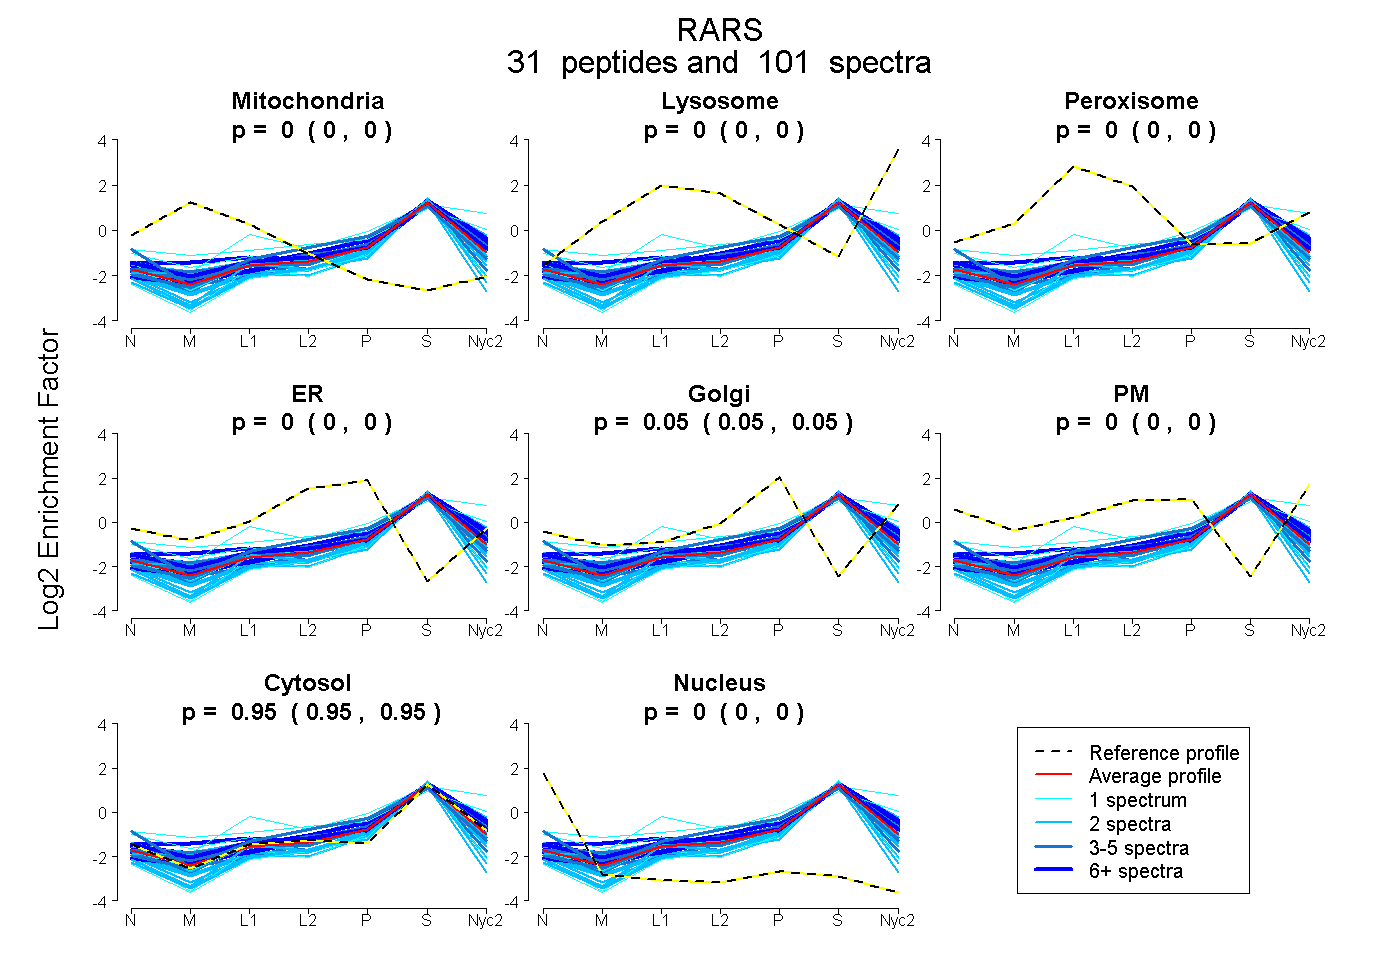
0.000 | 0.000
0.000 | 0.000
0.000 | 0.000
0.000 | 0.000
0.047 | 0.050
0.000 | 0.000
0.949 | 0.953
0.000 | 0.000
14peptides
spectra
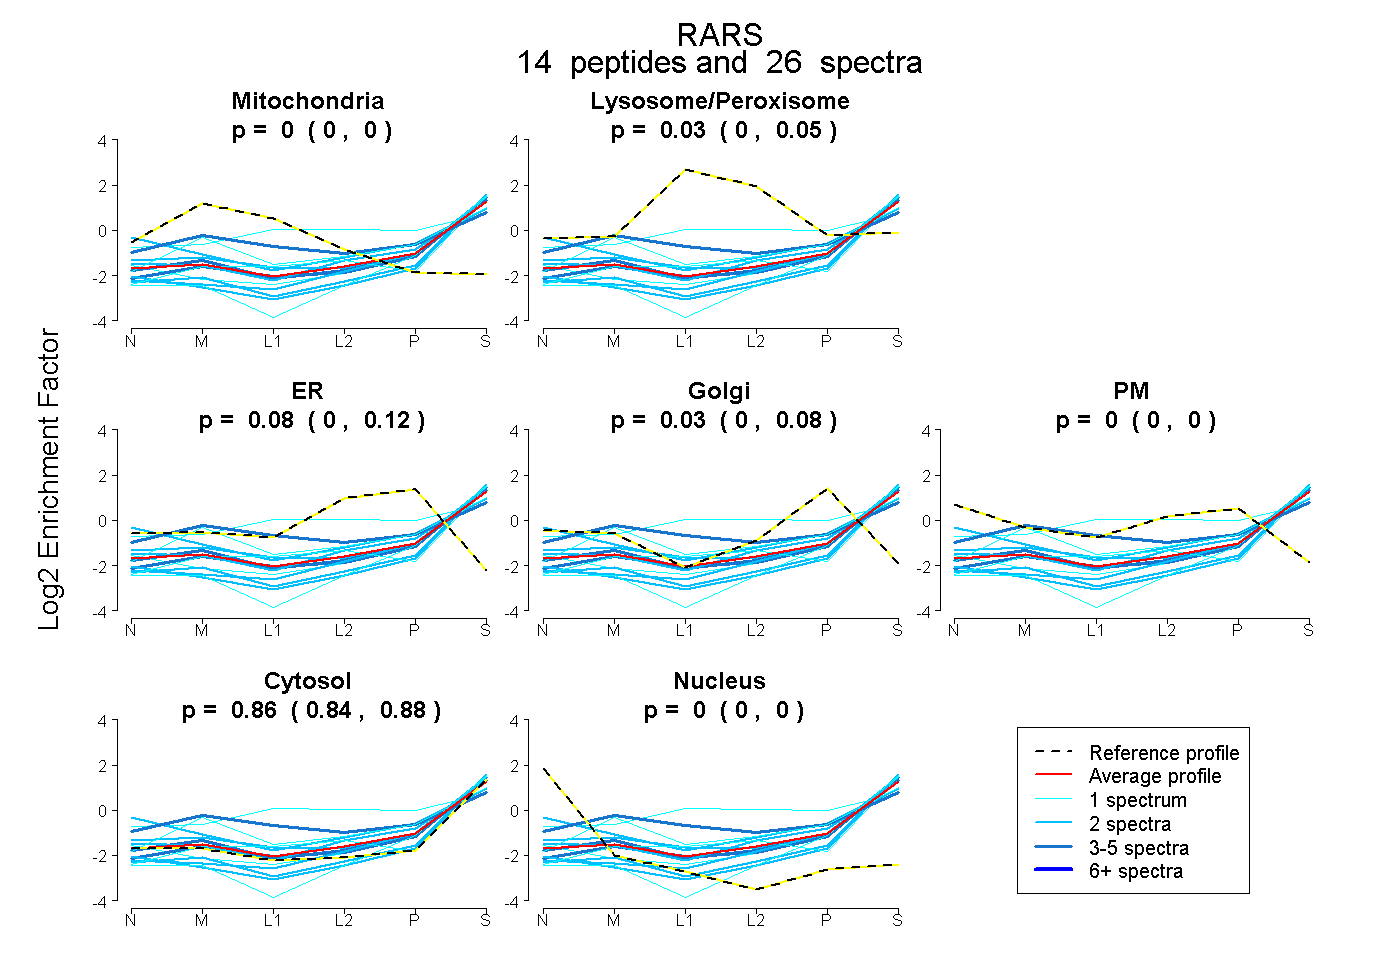
0.000 | 0.000
0.000 | 0.052
0.004 | 0.119
0.000 | 0.083
0.000 | 0.000
0.844 | 0.878
0.000 | 0.000