 31
31peptides
spectra
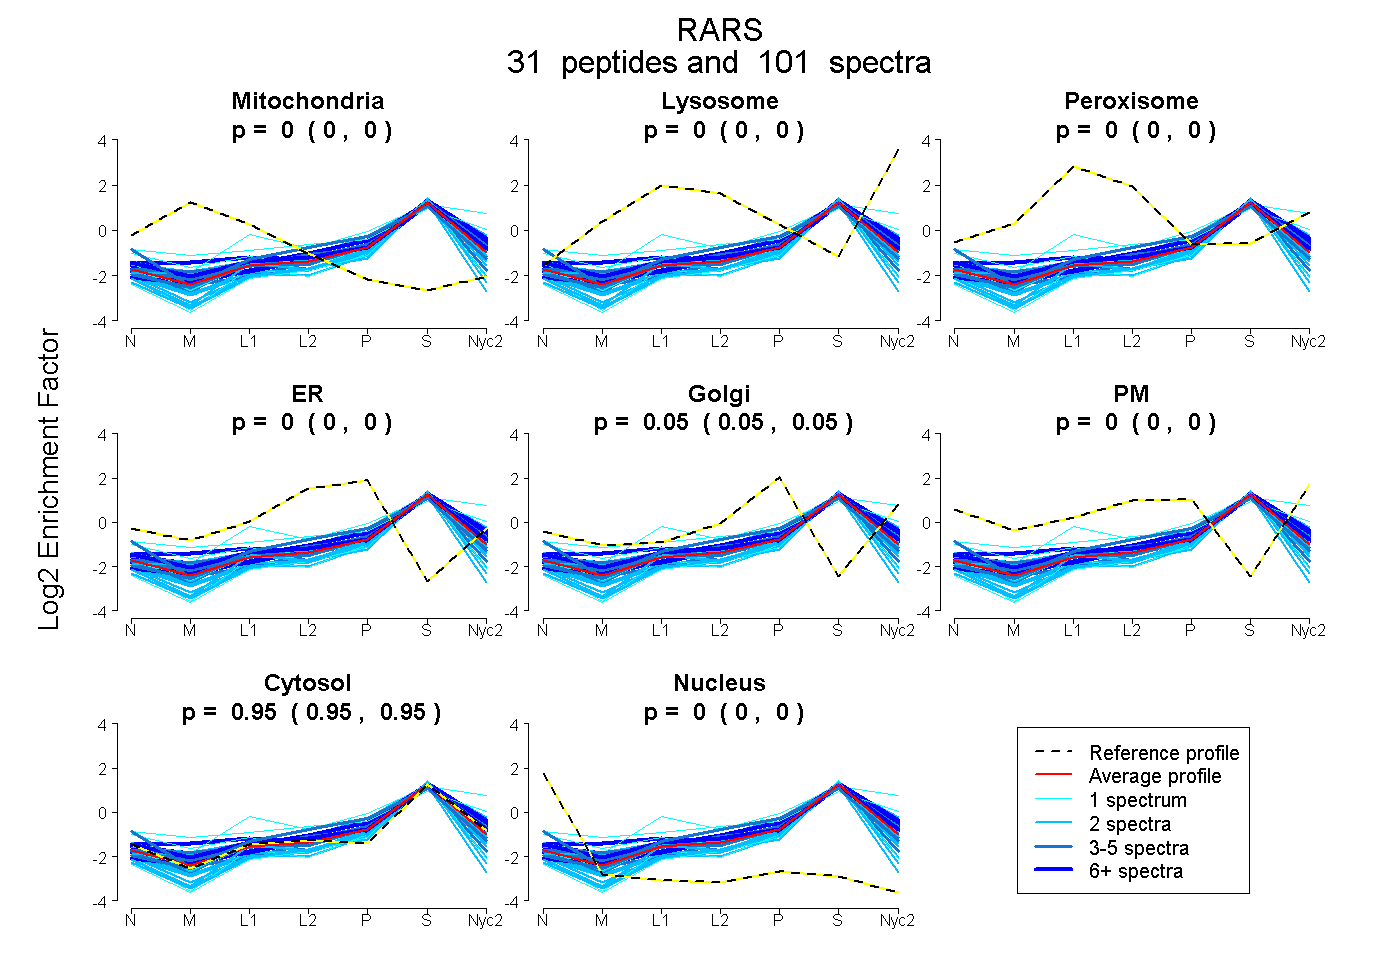
0.000 | 0.000
0.000 | 0.000
0.000 | 0.000
0.000 | 0.000
0.047 | 0.050
0.000 | 0.000
0.949 | 0.953
0.000 | 0.000
| Plot | Mito | Lyso | Perox | ER | Golgi | PM | Cytosol | Nucleus | |||||
| Expt A |
31 peptides |
101 spectra |
|
0.000 0.000 | 0.000 |
0.000 0.000 | 0.000 |
0.000 0.000 | 0.000 |
0.000 0.000 | 0.000 |
0.049 0.047 | 0.050 |
0.000 0.000 | 0.000 |
0.951 0.949 | 0.953 |
0.000 0.000 | 0.000 |
| 1 spectrum, LNDYVFSFDK | 0.000 | 0.000 | 0.000 | 0.000 | 0.060 | 0.000 | 0.940 | 0.000 | ||
| 6 spectra, NMININSR | 0.000 | 0.036 | 0.000 | 0.000 | 0.106 | 0.000 | 0.857 | 0.000 | ||
| 4 spectra, YADLSHNR | 0.000 | 0.000 | 0.000 | 0.159 | 0.000 | 0.000 | 0.836 | 0.005 | ||
| 1 spectrum, SDGGYTYDTSDLAAIK | 0.000 | 0.000 | 0.000 | 0.000 | 0.000 | 0.000 | 0.957 | 0.043 | ||
| 7 spectra, LANIDEEMLQR | 0.000 | 0.017 | 0.000 | 0.000 | 0.087 | 0.000 | 0.895 | 0.000 | ||
| 1 spectrum, IVFVPGCSVPLTIVK | 0.000 | 0.306 | 0.000 | 0.000 | 0.000 | 0.000 | 0.694 | 0.000 | ||
| 9 spectra, GESFYQDR | 0.000 | 0.000 | 0.000 | 0.000 | 0.090 | 0.000 | 0.910 | 0.000 | ||
| 6 spectra, LFEFAGYNVLR | 0.000 | 0.000 | 0.000 | 0.000 | 0.071 | 0.000 | 0.929 | 0.000 | ||
| 2 spectra, MLLCEAVAAVMAK | 0.091 | 0.000 | 0.000 | 0.000 | 0.000 | 0.000 | 0.844 | 0.065 | ||
| 1 spectrum, IYDALDITLIER | 0.000 | 0.000 | 0.000 | 0.000 | 0.032 | 0.000 | 0.968 | 0.000 | ||
| 2 spectra, FPEILQK | 0.000 | 0.000 | 0.000 | 0.000 | 0.000 | 0.000 | 0.970 | 0.030 | ||
| 1 spectrum, NCSYLEASPSLEQLR | 0.115 | 0.000 | 0.000 | 0.000 | 0.045 | 0.000 | 0.840 | 0.000 | ||
| 3 spectra, AAQTSVAYGCIK | 0.000 | 0.000 | 0.000 | 0.000 | 0.000 | 0.000 | 0.970 | 0.030 | ||
| 2 spectra, VEIAGPGFINVHLR | 0.000 | 0.000 | 0.000 | 0.000 | 0.000 | 0.000 | 1.000 | 0.000 | ||
| 2 spectra, AYECVVLLQSK | 0.000 | 0.000 | 0.000 | 0.047 | 0.000 | 0.000 | 0.926 | 0.028 | ||
| 2 spectra, EMHVGHLR | 0.000 | 0.000 | 0.000 | 0.000 | 0.000 | 0.000 | 0.982 | 0.018 | ||
| 2 spectra, GFDILGIKPVQR | 0.000 | 0.000 | 0.000 | 0.000 | 0.000 | 0.000 | 1.000 | 0.000 | ||
| 2 spectra, STIIGESMSR | 0.046 | 0.000 | 0.000 | 0.000 | 0.000 | 0.000 | 0.954 | 0.000 | ||
| 2 spectra, AWNLICDVSR | 0.000 | 0.000 | 0.000 | 0.000 | 0.000 | 0.000 | 0.931 | 0.069 | ||
| 3 spectra, LQELFGCAIK | 0.000 | 0.000 | 0.000 | 0.034 | 0.012 | 0.000 | 0.954 | 0.000 | ||
| 9 spectra, EIAENITK | 0.091 | 0.044 | 0.000 | 0.000 | 0.027 | 0.000 | 0.839 | 0.000 | ||
| 1 spectrum, GNTAAYLLYAFTR | 0.000 | 0.000 | 0.000 | 0.000 | 0.000 | 0.000 | 0.991 | 0.009 | ||
| 5 spectra, FDTEEEFK | 0.000 | 0.000 | 0.000 | 0.000 | 0.034 | 0.000 | 0.966 | 0.000 | ||
| 3 spectra, VAHVGFGVVLGEDK | 0.003 | 0.017 | 0.000 | 0.000 | 0.076 | 0.000 | 0.905 | 0.000 | ||
| 2 spectra, SGETVR | 0.000 | 0.037 | 0.000 | 0.000 | 0.084 | 0.000 | 0.879 | 0.000 | ||
| 2 spectra, HLPNNEYIDR | 0.000 | 0.026 | 0.000 | 0.000 | 0.052 | 0.000 | 0.922 | 0.000 | ||
| 6 spectra, LMDLLEEGLR | 0.000 | 0.023 | 0.000 | 0.000 | 0.039 | 0.000 | 0.938 | 0.000 | ||
| 4 spectra, SLTAEIDR | 0.000 | 0.000 | 0.000 | 0.000 | 0.070 | 0.000 | 0.930 | 0.000 | ||
| 7 spectra, VLTEEELK | 0.000 | 0.000 | 0.009 | 0.000 | 0.093 | 0.000 | 0.898 | 0.000 | ||
| 1 spectrum, NPDIMK | 0.000 | 0.100 | 0.053 | 0.000 | 0.047 | 0.106 | 0.694 | 0.000 | ||
| 2 spectra, IILDHEK | 0.000 | 0.000 | 0.000 | 0.000 | 0.000 | 0.000 | 1.000 | 0.000 |
| Plot | Mito | Lyso or Perox | ER | Golgi | PM | Cytosol | Nucleus | ||||||
| Expt B |
14 peptides |
26 spectra |
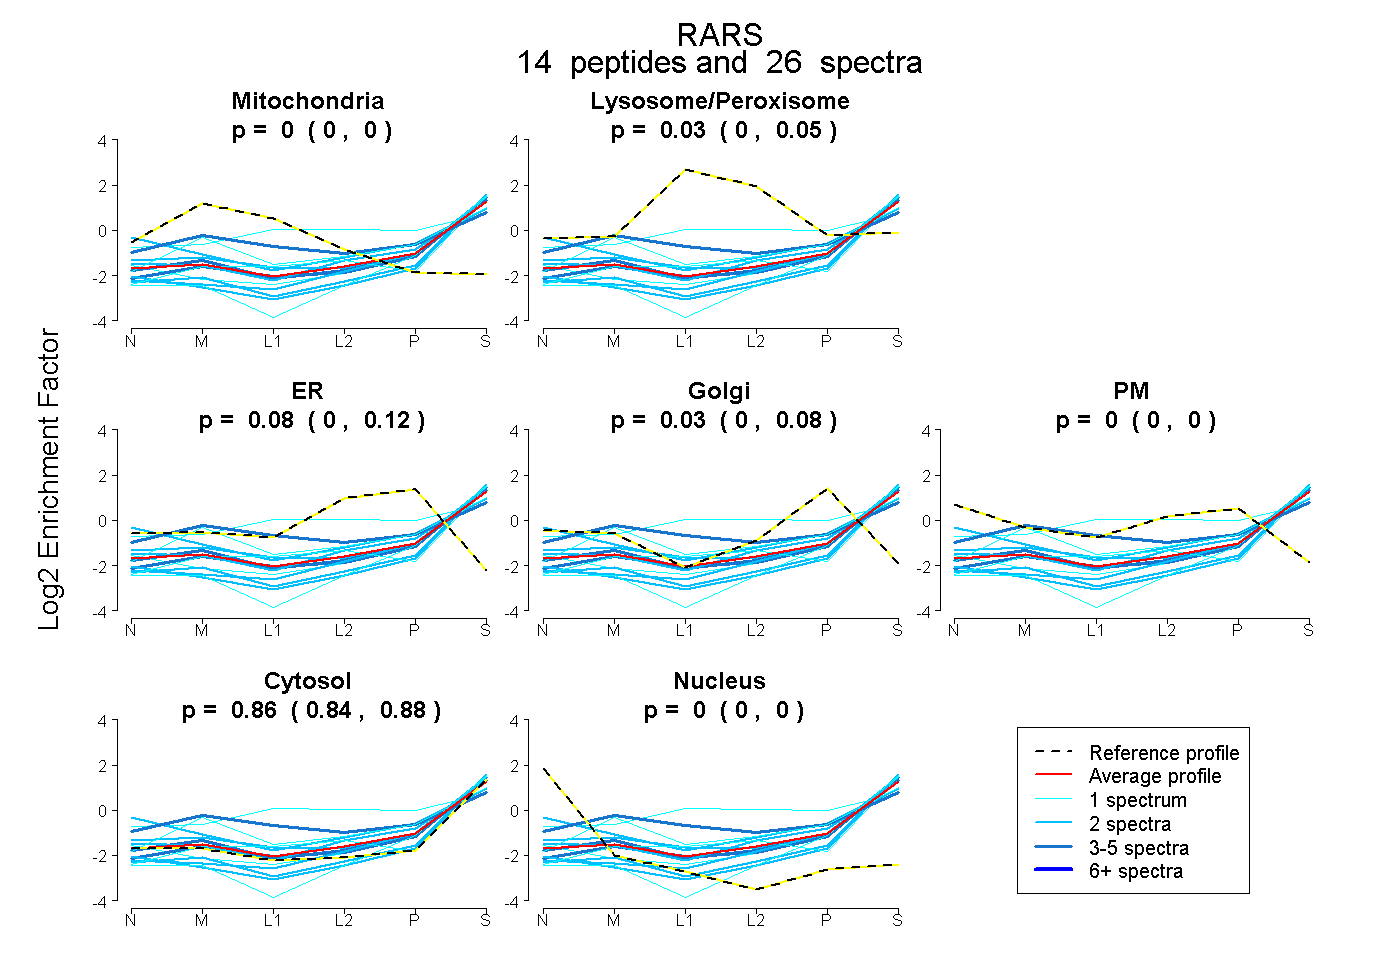 |
0.000 0.000 | 0.000 |
0.027 0.000 | 0.052 |
0.078 0.004 | 0.119 |
0.031 0.000 | 0.083 |
0.000 0.000 | 0.000 |
0.864 0.844 | 0.878 |
0.000 0.000 | 0.000 |
|||
| Plot | Lyso | Other | |||||||||||
| Expt C |
21 peptides |
61 spectra |
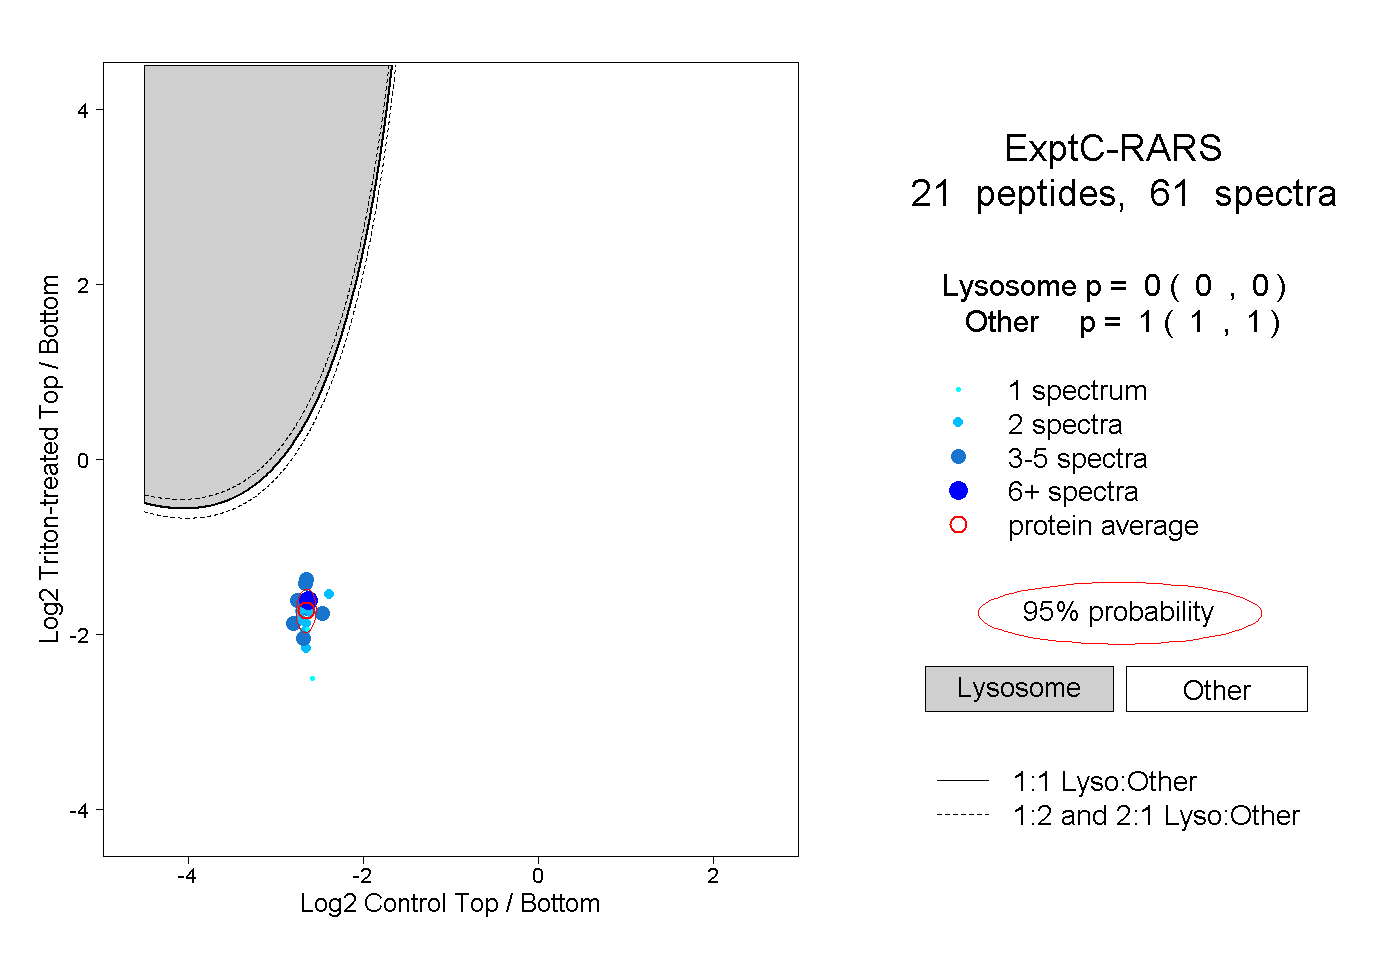 |
0.000 0.000 | 0.000 |
1.000 1.000 | 1.000 |
||||||||
| Plot | Lyso | Other | |||||||||||
| Expt D |
4 peptides |
7 spectra |
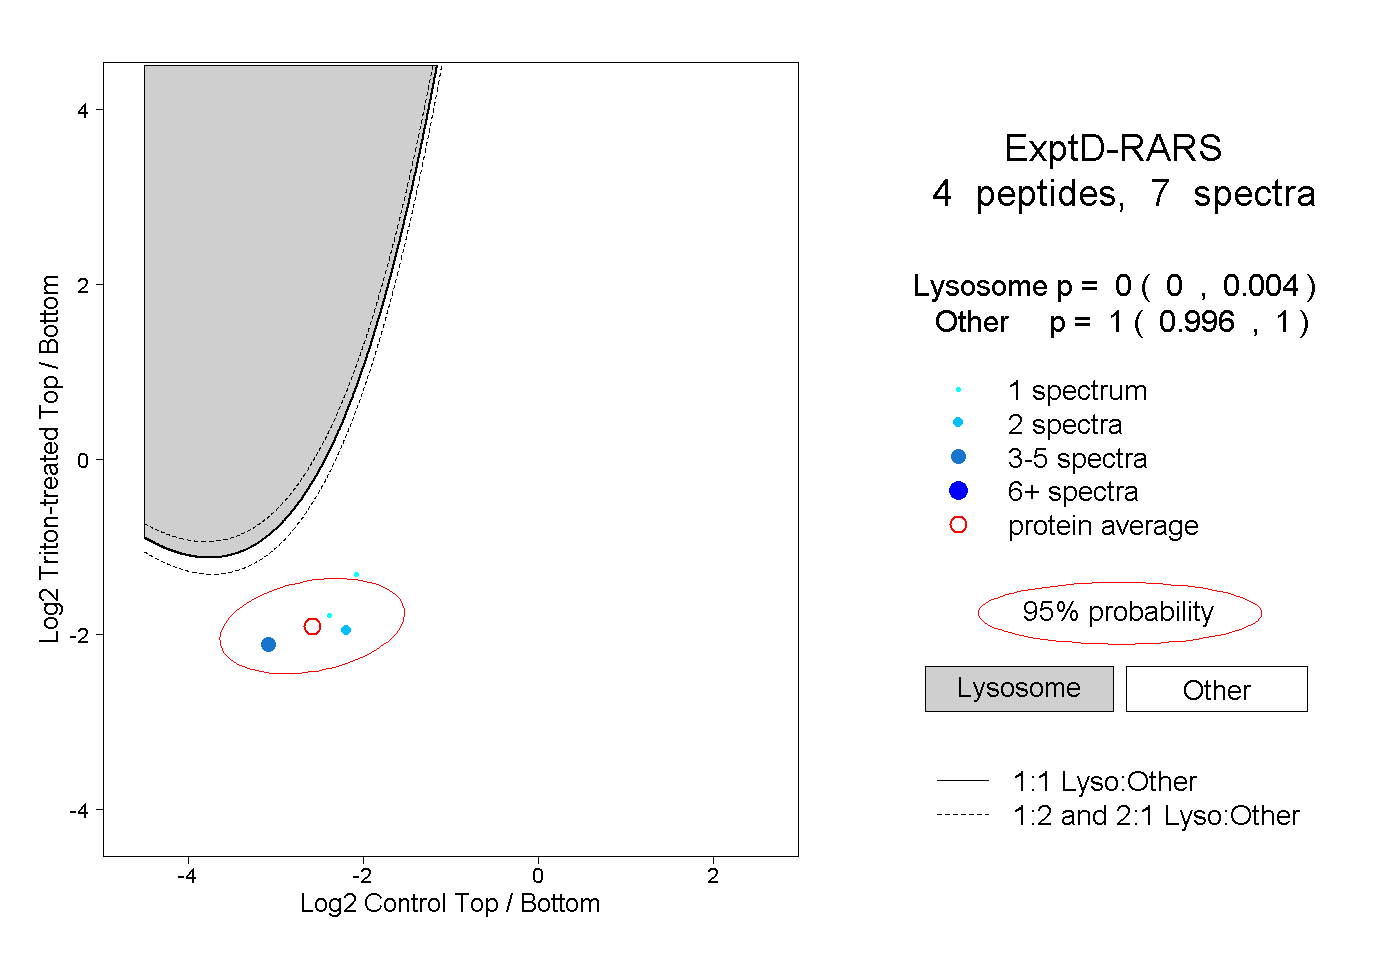 |
0.000 0.000 | 0.004 |
1.000 0.996 | 1.000 |