 5
5peptides
spectra
0.000 | 0.000
0.000 | 0.000
0.000 | 0.000
0.000 | 0.000
0.066 | 0.104
0.000 | 0.000
0.854 | 0.884
0.026 | 0.057
4peptides
spectra
0.000 | 0.000
1.000 | 1.000
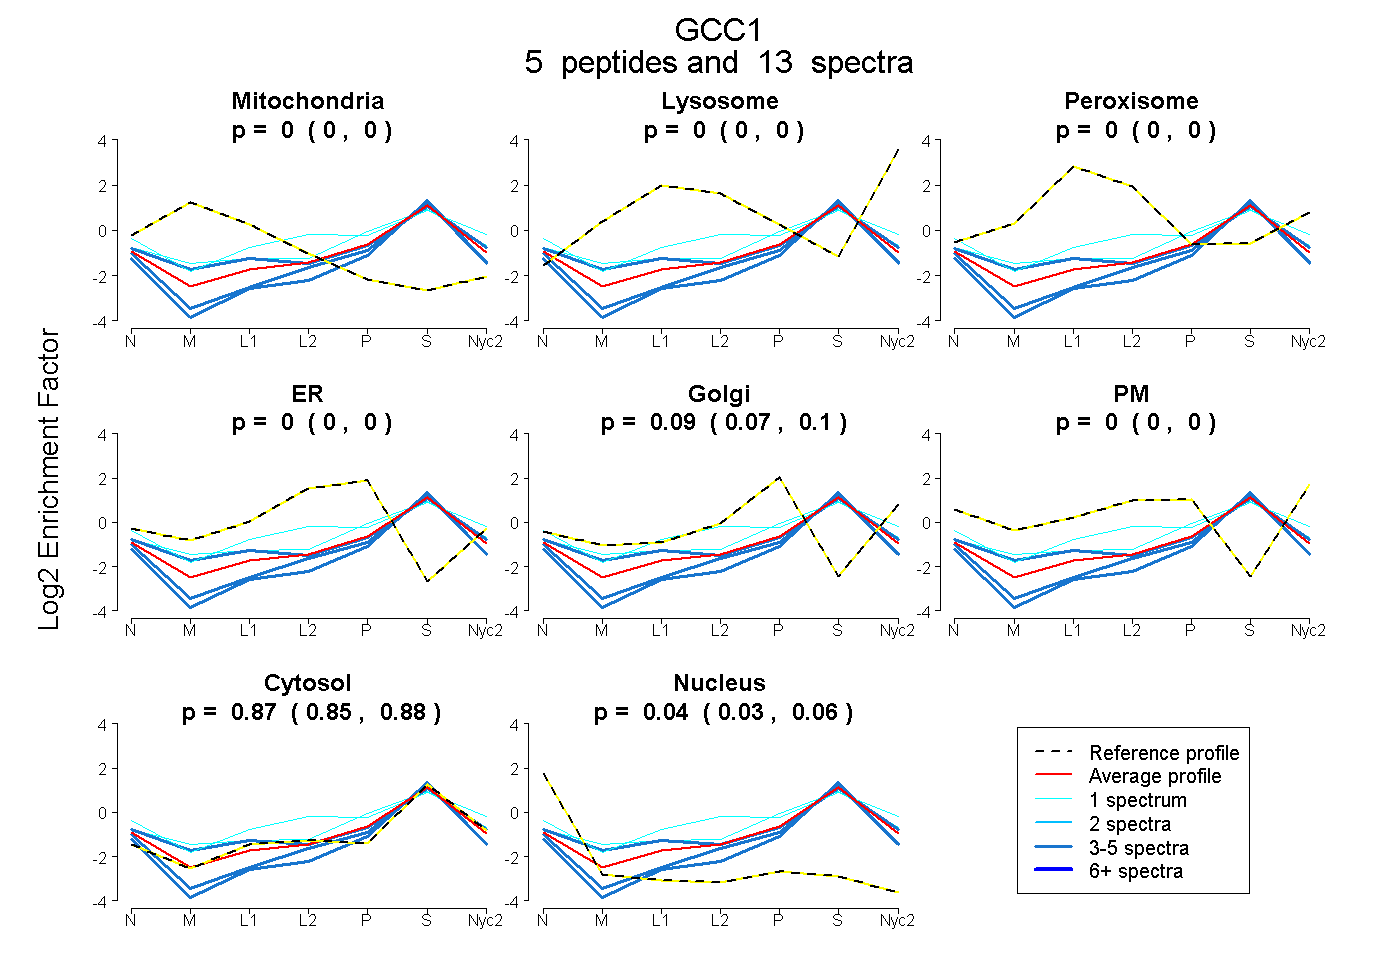
| Plot | Mito | Lyso | Perox | ER | Golgi | PM | Cytosol | Nucleus | |||||
| Expt A |
5 peptides |
13 spectra |
|
0.000 0.000 | 0.000 |
0.000 0.000 | 0.000 |
0.000 0.000 | 0.000 |
0.000 0.000 | 0.000 |
0.087 0.066 | 0.104 |
0.000 0.000 | 0.000 |
0.870 0.854 | 0.884 |
0.043 0.026 | 0.057 |
||
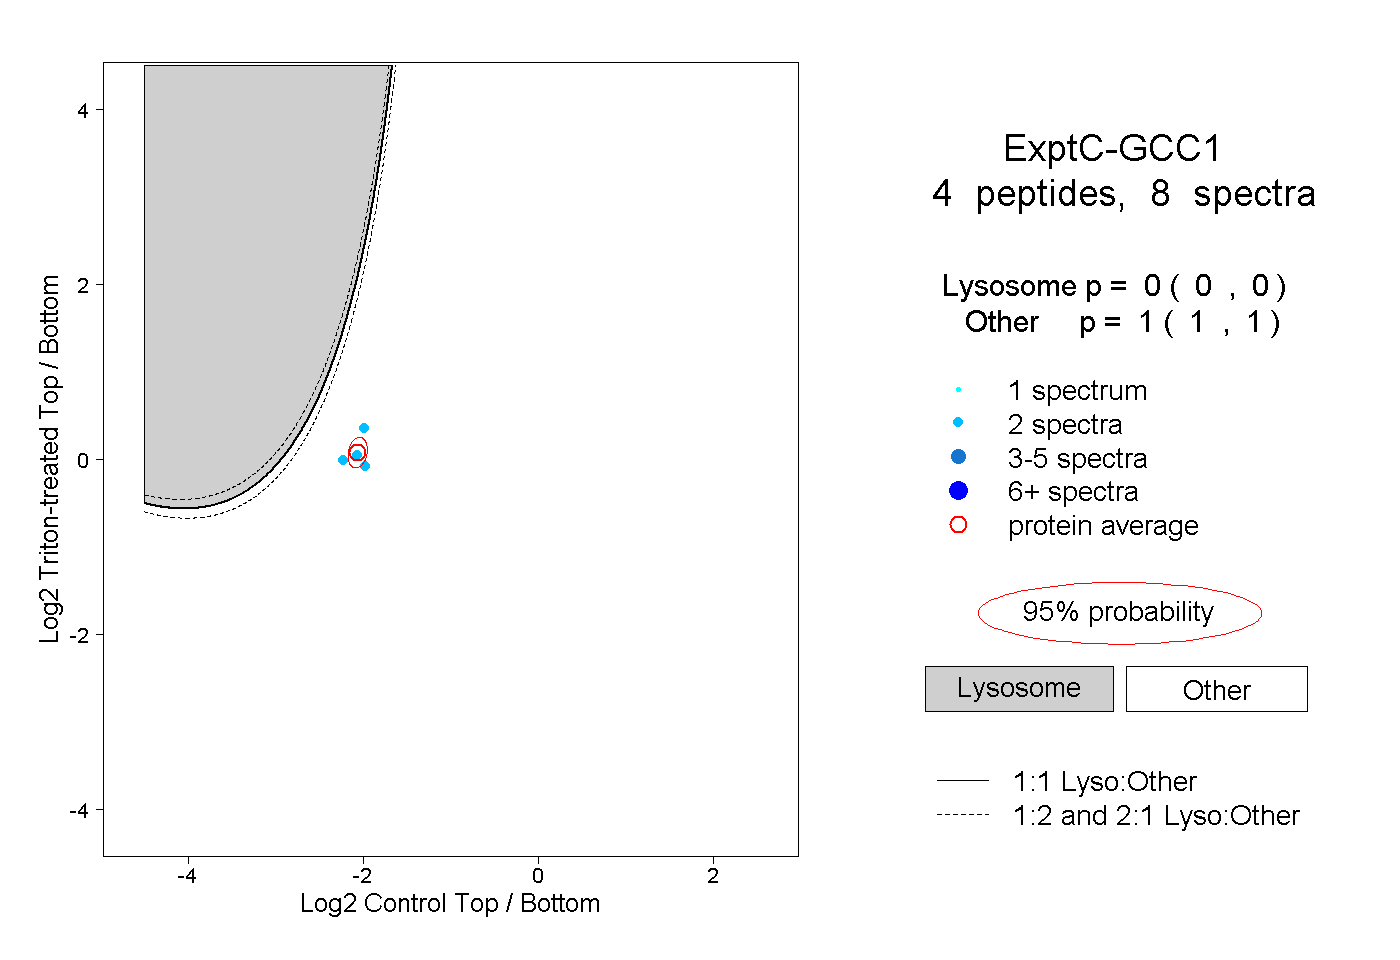
| Plot | Lyso | Other | |||||||||||
| Expt C |
4 peptides |
8 spectra |
|
0.000 0.000 | 0.000 |
1.000 1.000 | 1.000 |