 1
1peptide
spectra
0.000 | 0.000
0.032 | 0.094
0.000 | 0.057
0.000 | 0.000
0.242 | 0.343
0.156 | 0.292
0.352 | 0.397
0.000 | 0.000
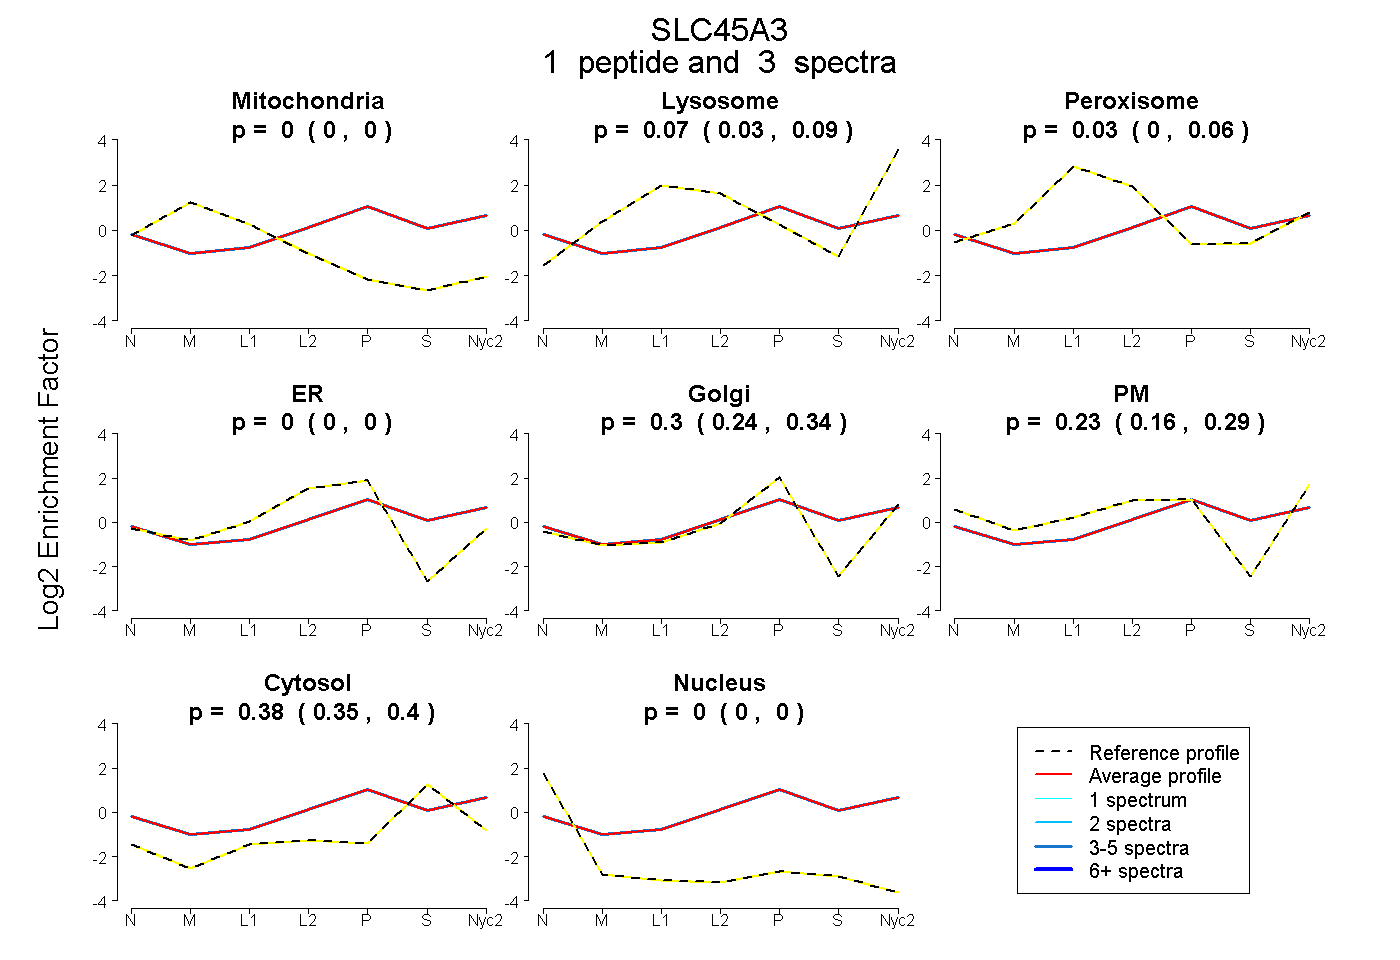
| Plot | Mito | Lyso | Perox | ER | Golgi | PM | Cytosol | Nucleus | |||||
| Expt A |
1 peptide |
3 spectra |
|
0.000 0.000 | 0.000 |
0.068 0.032 | 0.094 |
0.026 0.000 | 0.057 |
0.000 0.000 | 0.000 |
0.298 0.242 | 0.343 |
0.230 0.156 | 0.292 |
0.378 0.352 | 0.397 |
0.000 0.000 | 0.000 |