12
12peptides
spectra
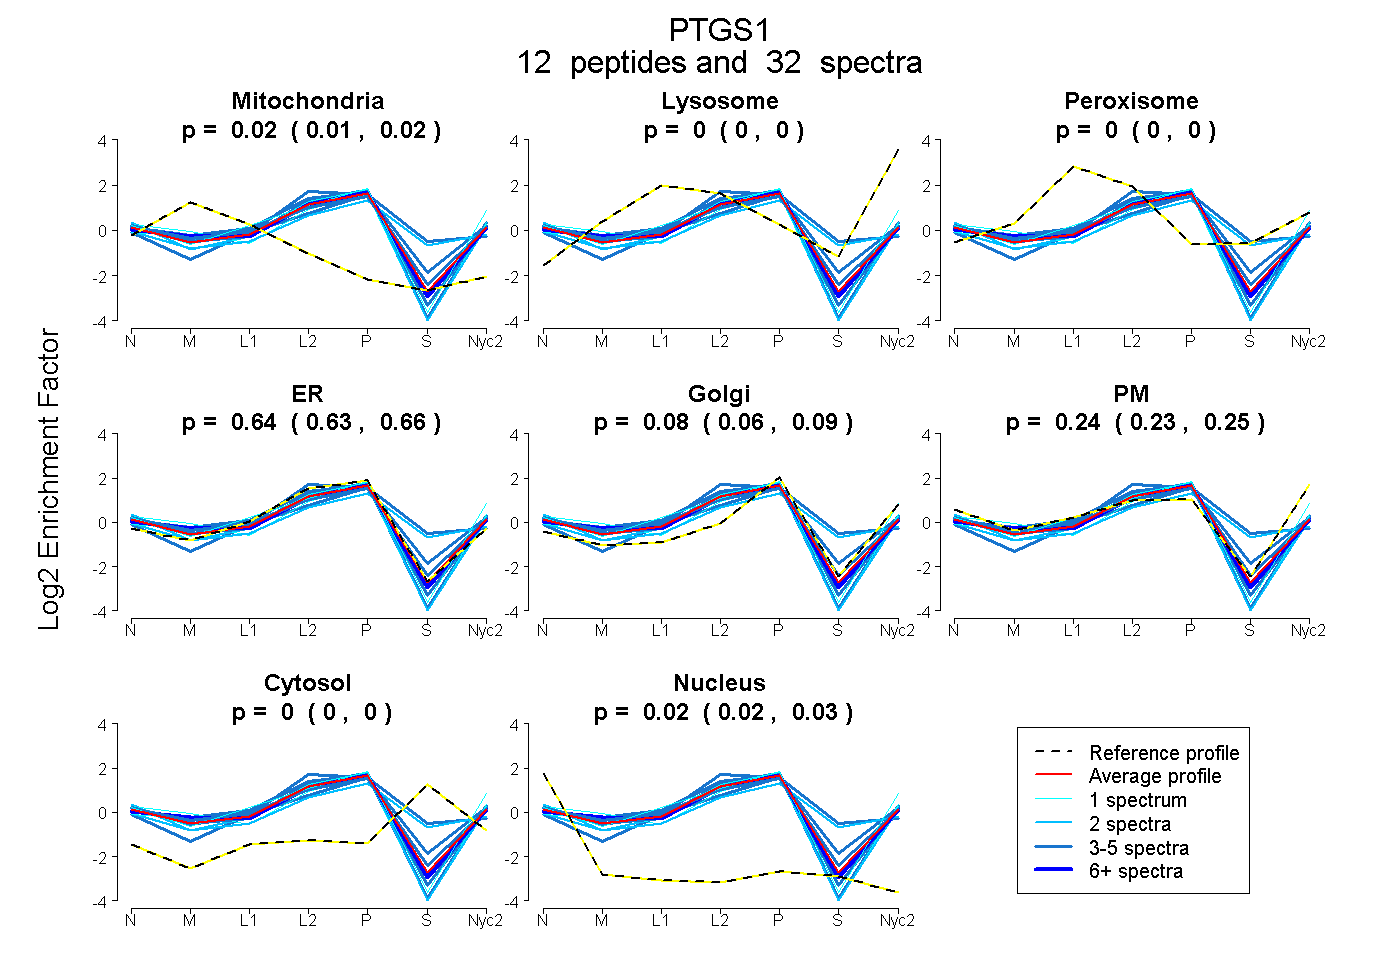
0.009 | 0.024
0.000 | 0.000
0.000 | 0.000
0.625 | 0.656
0.059 | 0.089
0.234 | 0.252
0.000 | 0.000
0.016 | 0.026
7peptides
spectra
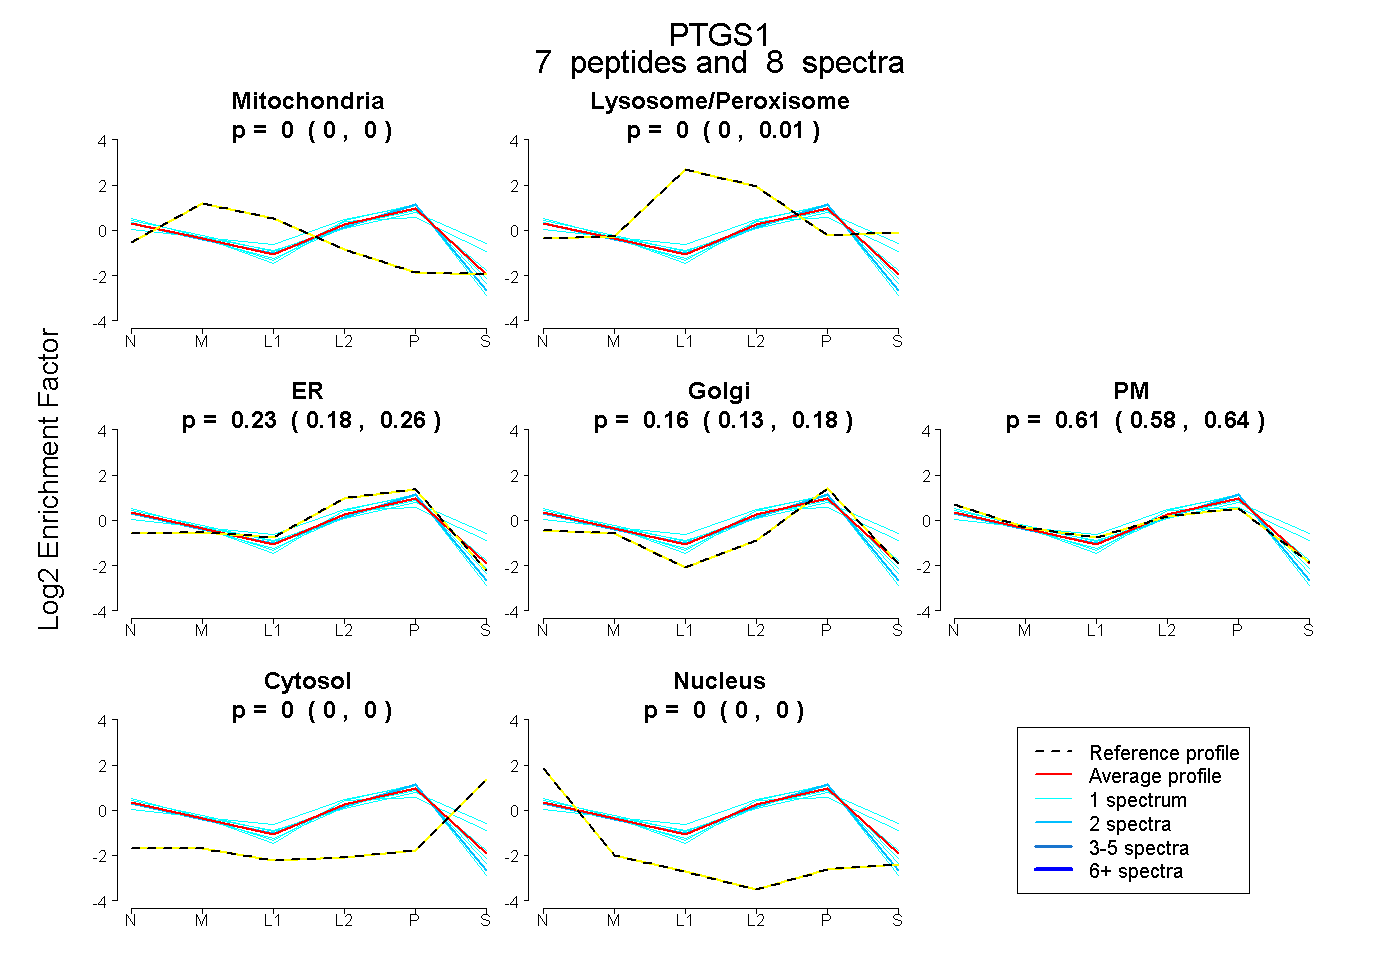
0.000 | 0.000
0.000 | 0.007
0.184 | 0.263
0.128 | 0.183
0.577 | 0.637
0.000 | 0.000
0.000 | 0.000
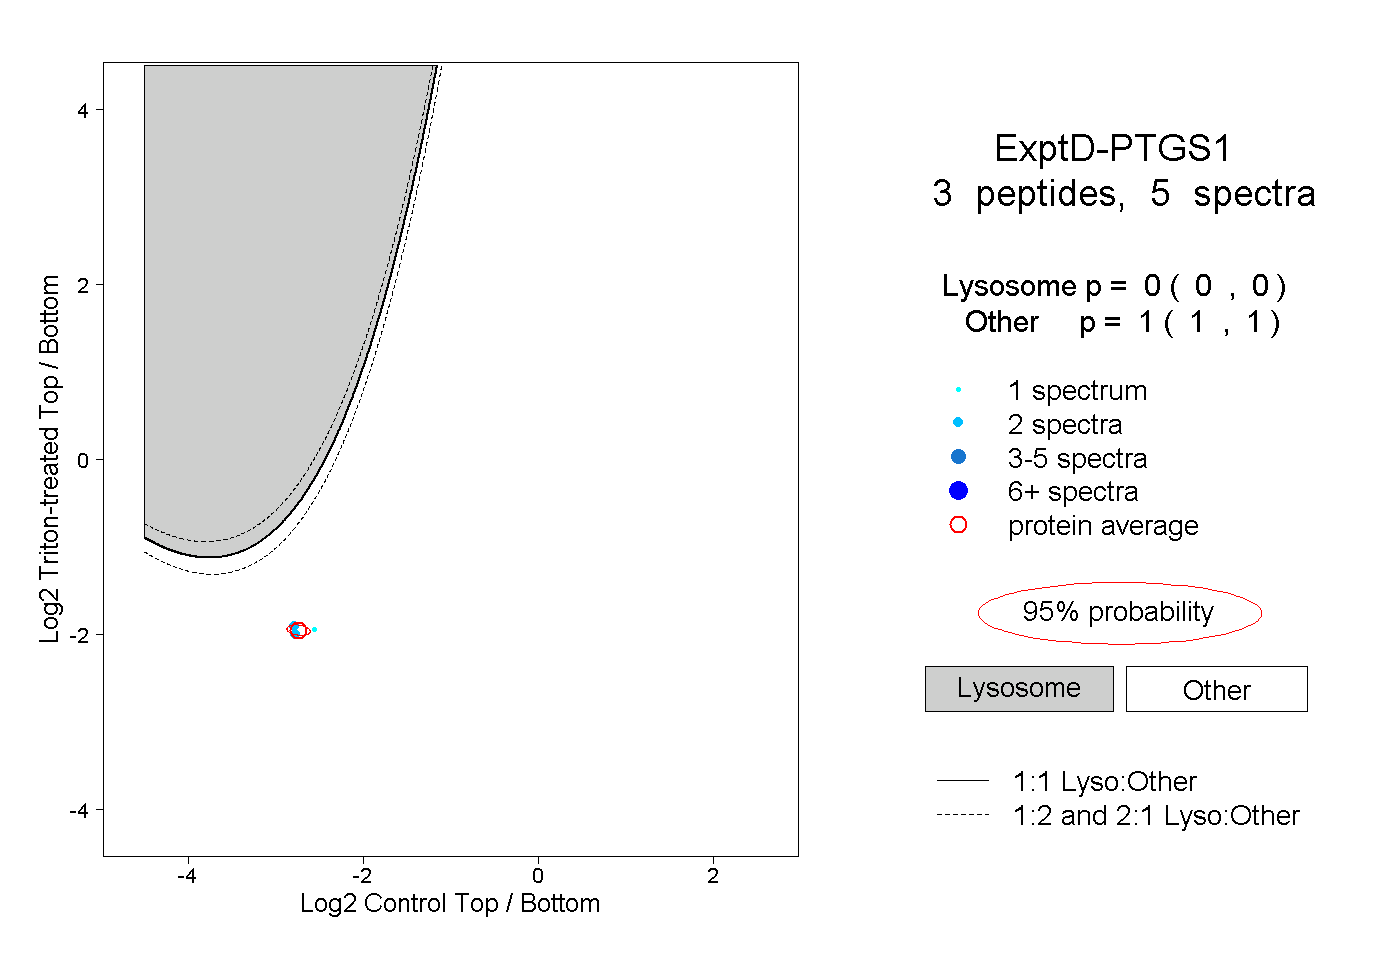
15peptides
spectra
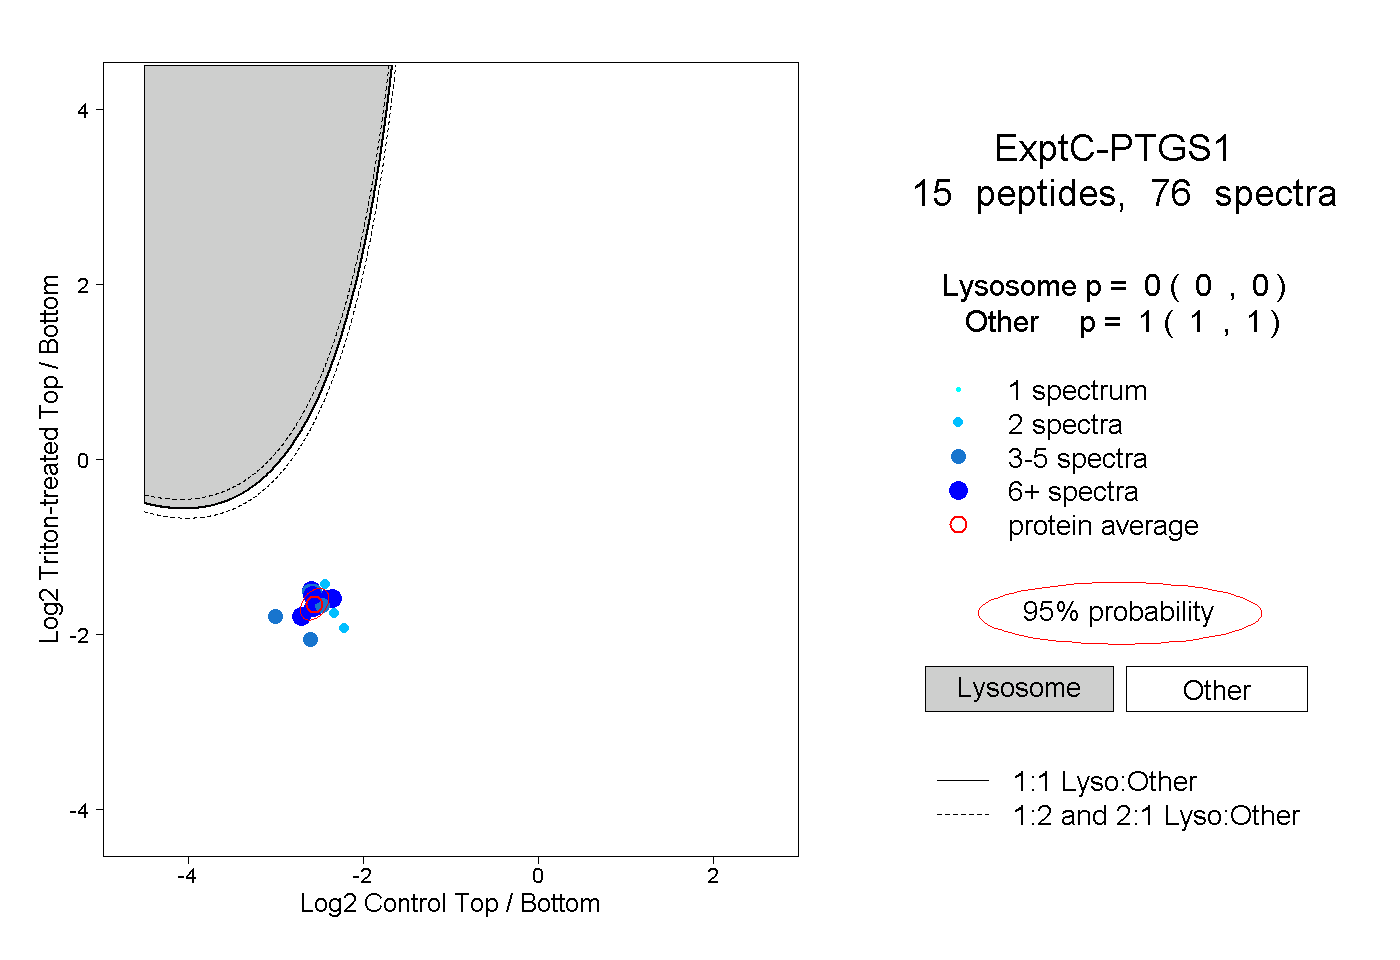
0.000 | 0.000
1.000 | 1.000