 12
12peptides
spectra
0.009 | 0.024
0.000 | 0.000
0.000 | 0.000
0.625 | 0.656
0.059 | 0.089
0.234 | 0.252
0.000 | 0.000
0.016 | 0.026
| Plot | Mito | Lyso | Perox | ER | Golgi | PM | Cytosol | Nucleus | |||||
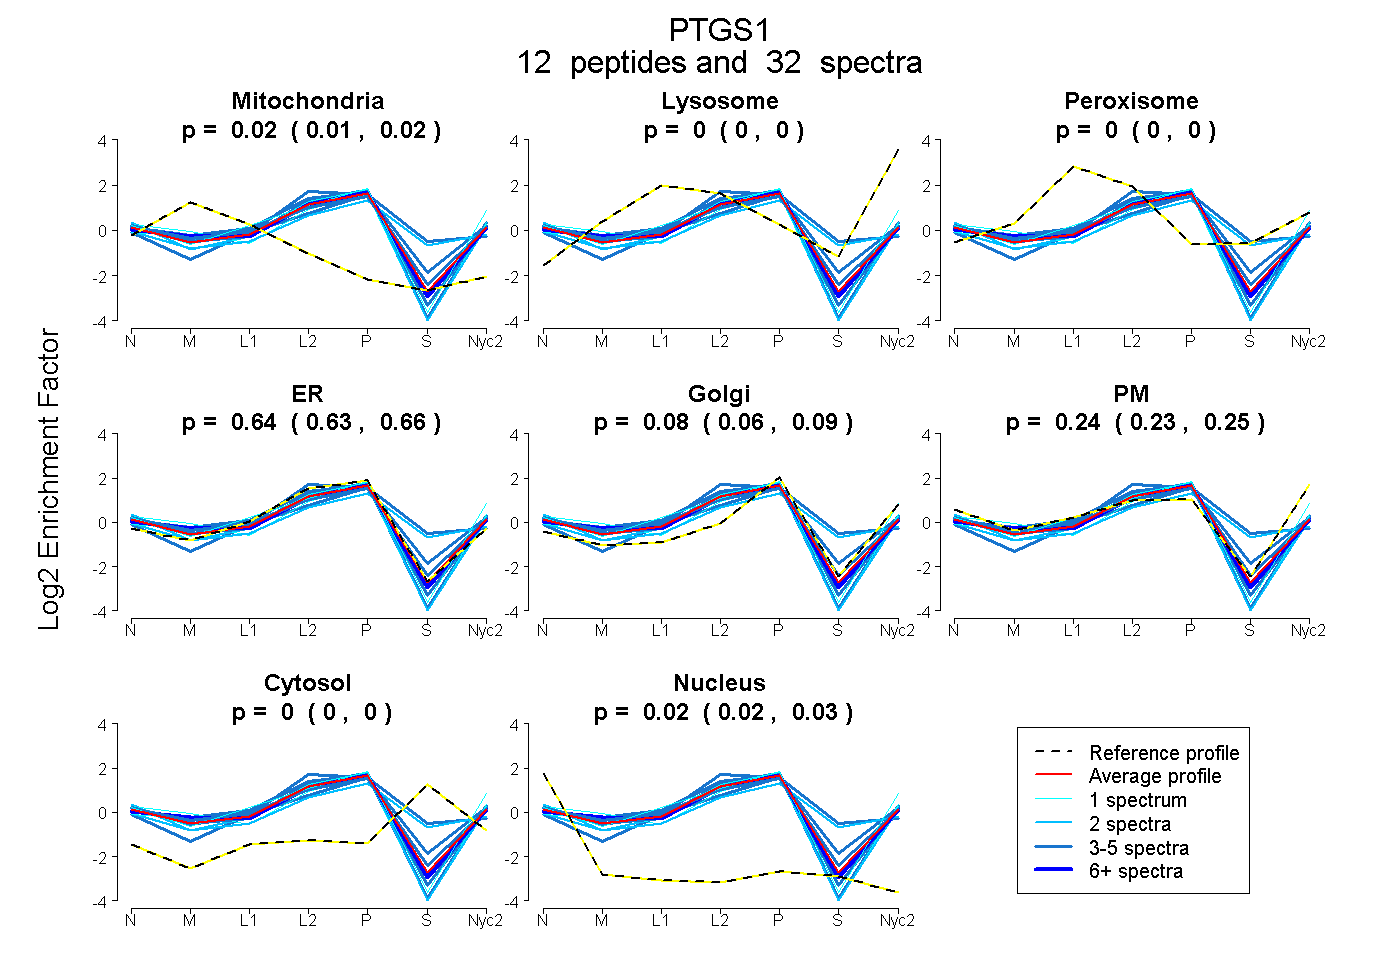
| Expt A |
12 peptides |
32 spectra |
|
0.018 0.009 | 0.024 |
0.000 0.000 | 0.000 |
0.000 0.000 | 0.000 |
0.642 0.625 | 0.656 |
0.075 0.059 | 0.089 |
0.244 0.234 | 0.252 |
0.000 0.000 | 0.000 |
0.021 0.016 | 0.026 |
| 6 spectra, QLPDIHLLAQR | 0.060 | 0.000 | 0.000 | 0.616 | 0.126 | 0.198 | 0.000 | 0.000 | ||
| 3 spectra, EEHPTWDDEQLFQTTR | 0.018 | 0.000 | 0.000 | 0.694 | 0.000 | 0.288 | 0.000 | 0.000 | ||
| 1 spectrum, YPPGVPPEK | 0.000 | 0.000 | 0.000 | 0.480 | 0.057 | 0.463 | 0.000 | 0.000 | ||
| 4 spectra, TCPYVSFR | 0.078 | 0.000 | 0.000 | 0.560 | 0.087 | 0.274 | 0.000 | 0.001 | ||
| 3 spectra, LVLTVR | 0.000 | 0.000 | 0.000 | 0.700 | 0.024 | 0.257 | 0.000 | 0.019 | ||
| 2 spectra, LQSFNEYR | 0.000 | 0.000 | 0.000 | 0.733 | 0.000 | 0.239 | 0.000 | 0.028 | ||
| 2 spectra, FDPELLFR | 0.000 | 0.000 | 0.000 | 0.738 | 0.005 | 0.218 | 0.000 | 0.038 | ||
| 1 spectrum, LILIGETIK | 0.062 | 0.000 | 0.000 | 0.475 | 0.161 | 0.290 | 0.000 | 0.013 | ||
| 1 spectrum, MGPGFTK | 0.020 | 0.000 | 0.000 | 0.646 | 0.111 | 0.223 | 0.000 | 0.000 | ||
| 3 spectra, DCPTPMGTK | 0.000 | 0.000 | 0.075 | 0.574 | 0.067 | 0.000 | 0.284 | 0.000 | ||
| 2 spectra, LVCLNTK | 0.000 | 0.000 | 0.029 | 0.485 | 0.061 | 0.138 | 0.286 | 0.000 | ||
| 4 spectra, AQFQYR | 0.000 | 0.000 | 0.052 | 0.660 | 0.000 | 0.243 | 0.045 | 0.000 |
| Plot | Mito | Lyso or Perox | ER | Golgi | PM | Cytosol | Nucleus | ||||||
| Expt B |
7 peptides |
8 spectra |
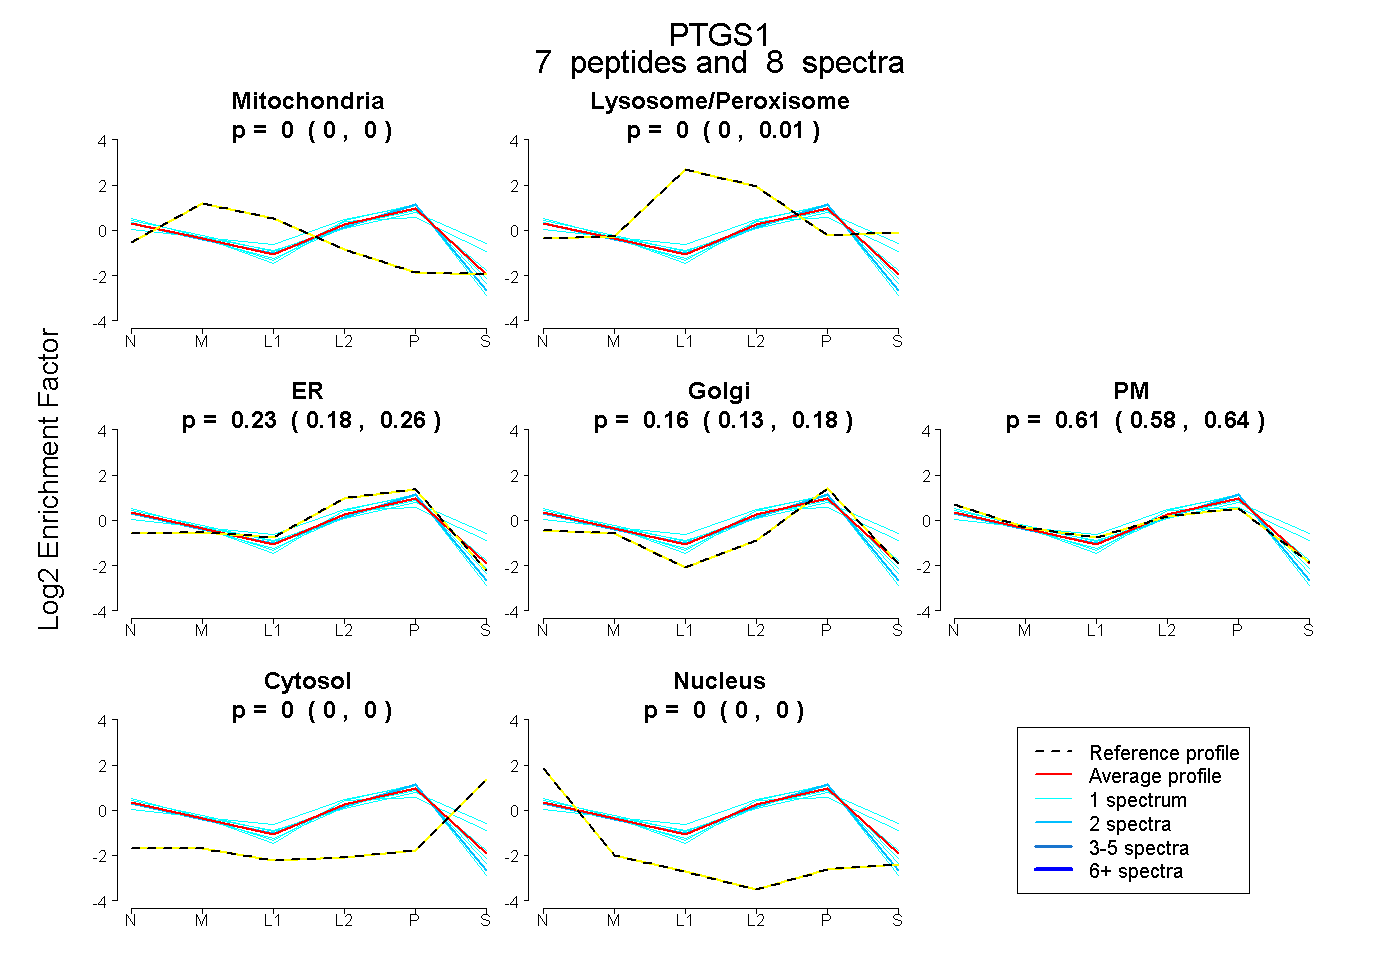 |
0.000 0.000 | 0.000 |
0.000 0.000 | 0.007 |
0.231 0.184 | 0.263 |
0.155 0.128 | 0.183 |
0.613 0.577 | 0.637 |
0.000 0.000 | 0.000 |
0.000 0.000 | 0.000 |
|||
| Plot | Lyso | Other | |||||||||||
| Expt C |
15 peptides |
76 spectra |
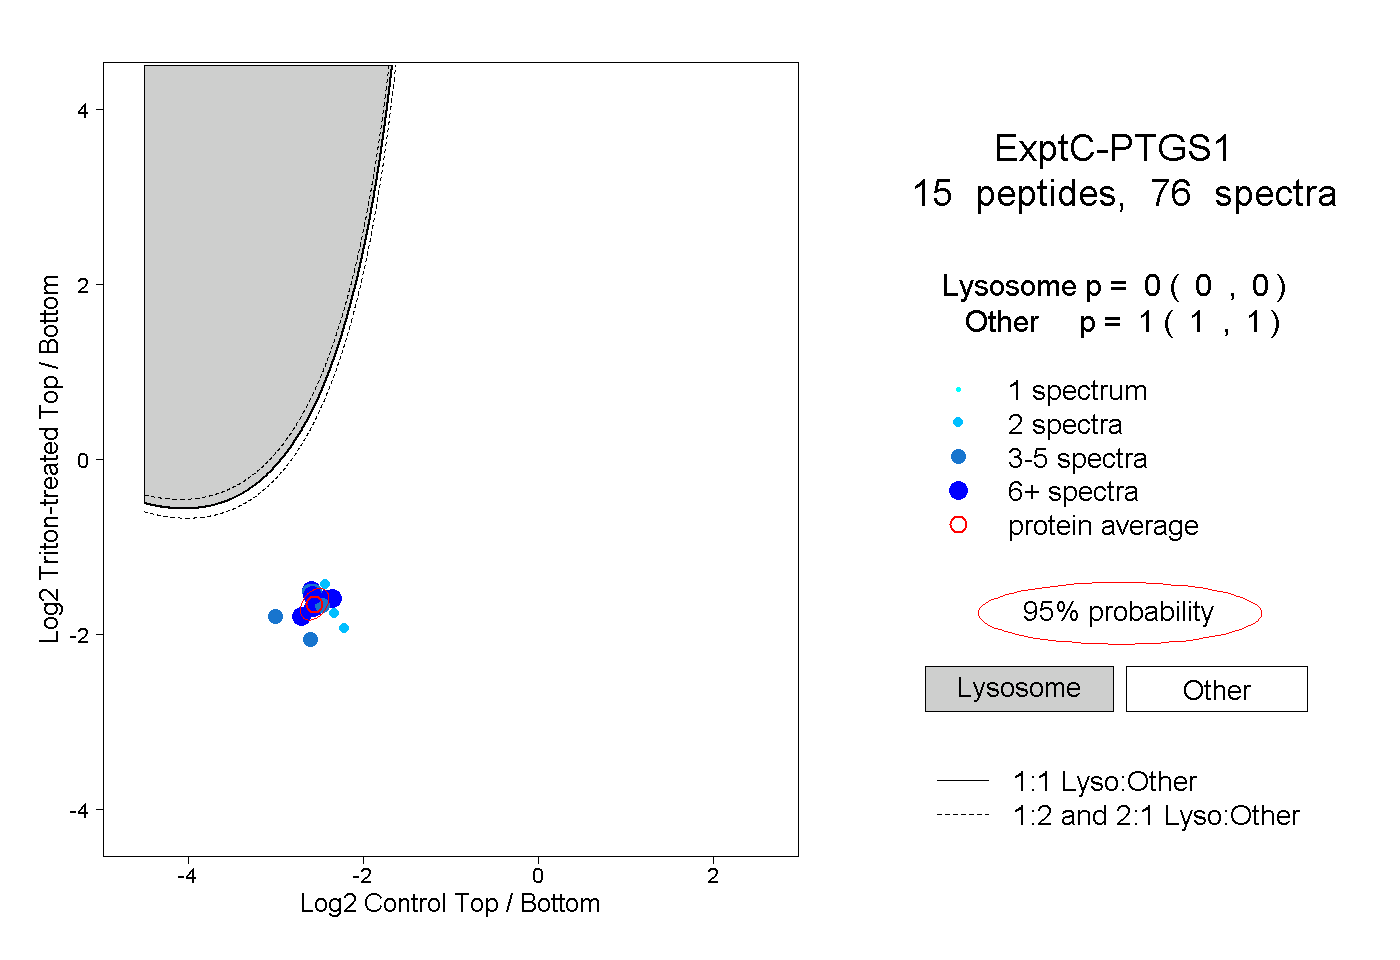 |
0.000 0.000 | 0.000 |
1.000 1.000 | 1.000 |
||||||||
| Plot | Lyso | Other | |||||||||||
| Expt D |
3 peptides |
5 spectra |
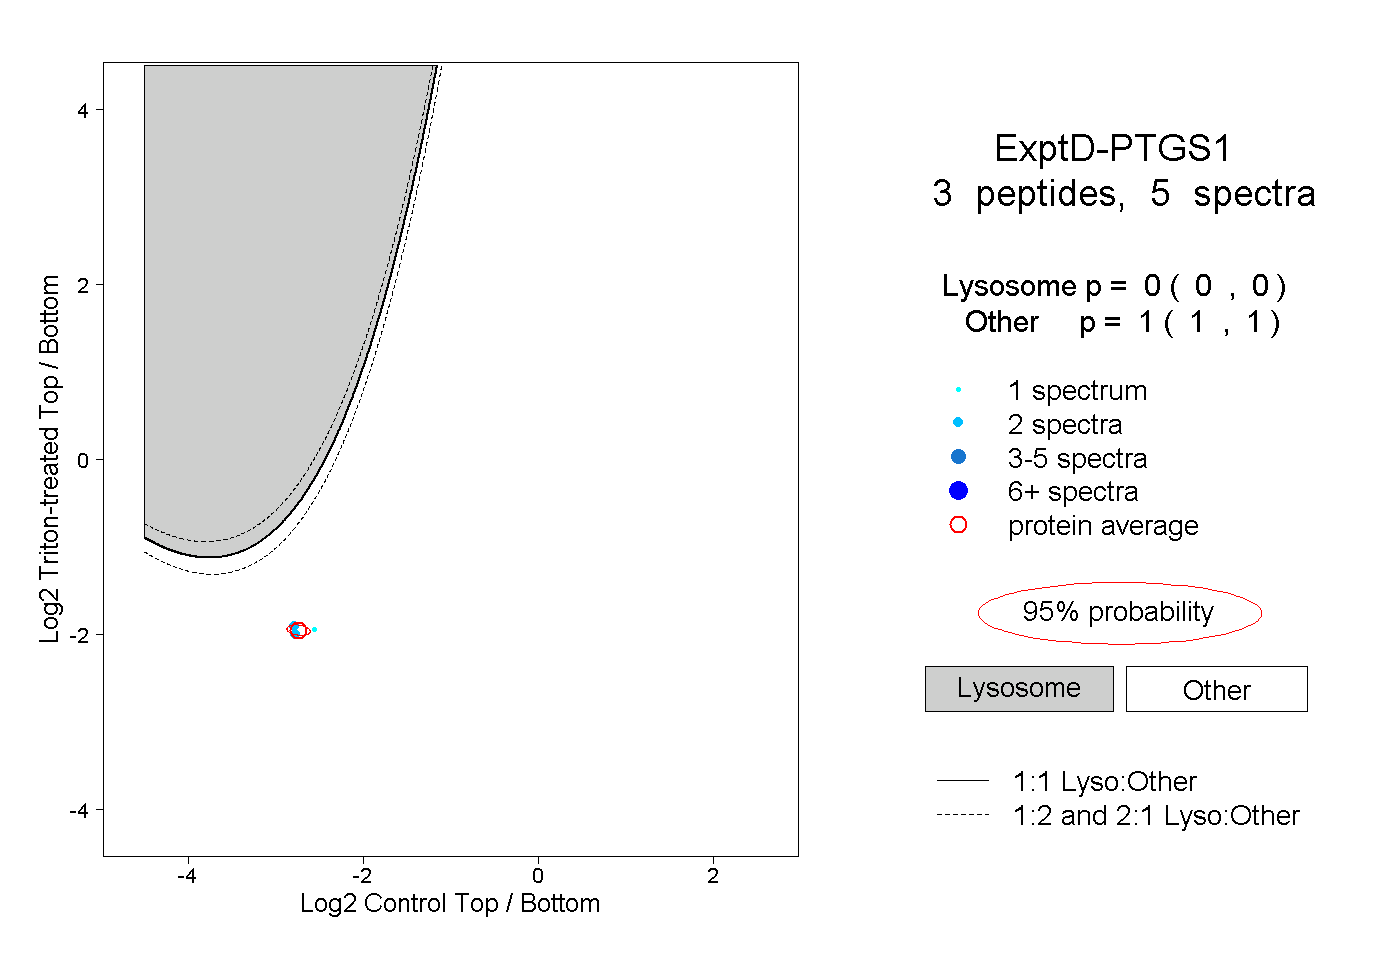 |
0.000 0.000 | 0.000 |
1.000 1.000 | 1.000 |