 7
7peptides
spectra
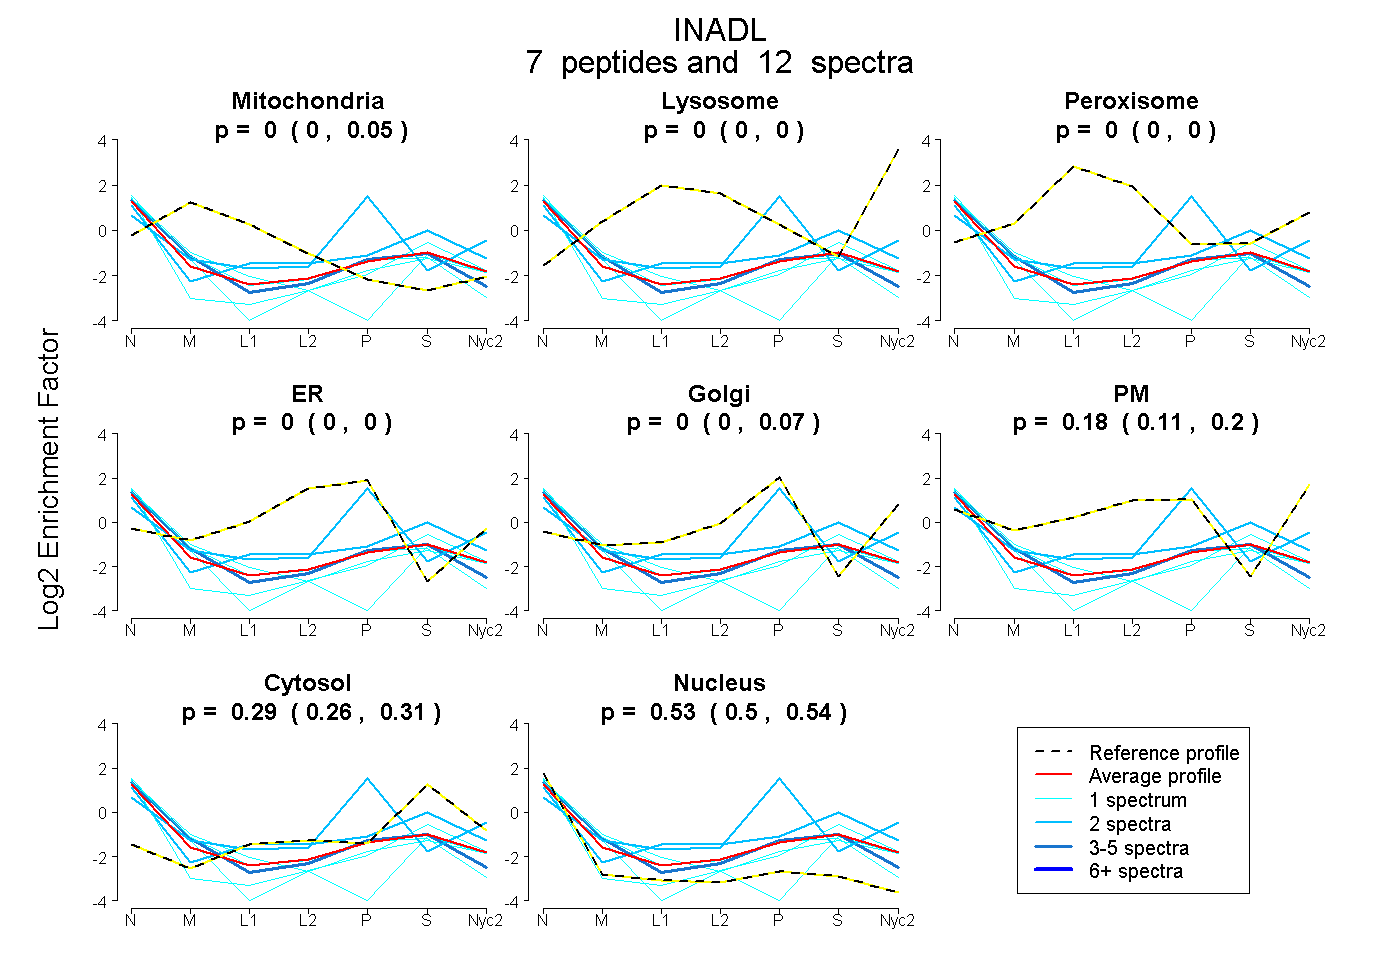
0.000 | 0.046
0.000 | 0.000
0.000 | 0.000
0.000 | 0.000
0.000 | 0.074
0.107 | 0.196
0.261 | 0.311
0.500 | 0.543
| Plot | Mito | Lyso | Perox | ER | Golgi | PM | Cytosol | Nucleus | |||||
| Expt A |
7 peptides |
12 spectra |
|
0.000 0.000 | 0.046 |
0.000 0.000 | 0.000 |
0.000 0.000 | 0.000 |
0.000 0.000 | 0.000 |
0.000 0.000 | 0.074 |
0.180 0.107 | 0.196 |
0.291 0.261 | 0.311 |
0.529 0.500 | 0.543 |
| 1 spectrum, MEAEEIGER | 0.159 | 0.000 | 0.000 | 0.054 | 0.031 | 0.000 | 0.192 | 0.564 | ||
| 4 spectra, LLPIHTLR | 0.103 | 0.000 | 0.000 | 0.000 | 0.114 | 0.000 | 0.232 | 0.551 | ||
| 1 spectrum, LFDDEASVDEPR | 0.181 | 0.000 | 0.000 | 0.000 | 0.000 | 0.104 | 0.205 | 0.509 | ||
| 2 spectra, EPTSASPR | 0.000 | 0.000 | 0.022 | 0.000 | 0.000 | 0.174 | 0.482 | 0.322 | ||
| 1 spectrum, DTPLDAIVIHEVYEEGAAAR | 0.048 | 0.000 | 0.000 | 0.000 | 0.000 | 0.000 | 0.238 | 0.713 | ||
| 2 spectra, TVEPSLLEAEVDR | 0.000 | 0.000 | 0.000 | 0.000 | 0.718 | 0.000 | 0.028 | 0.253 | ||
| 1 spectrum, IVEIFR | 0.000 | 0.000 | 0.000 | 0.000 | 0.000 | 0.000 | 0.401 | 0.599 |
| Plot | Mito | Lyso or Perox | ER | Golgi | PM | Cytosol | Nucleus | ||||||
| Expt B |
1 peptide |
2 spectra |
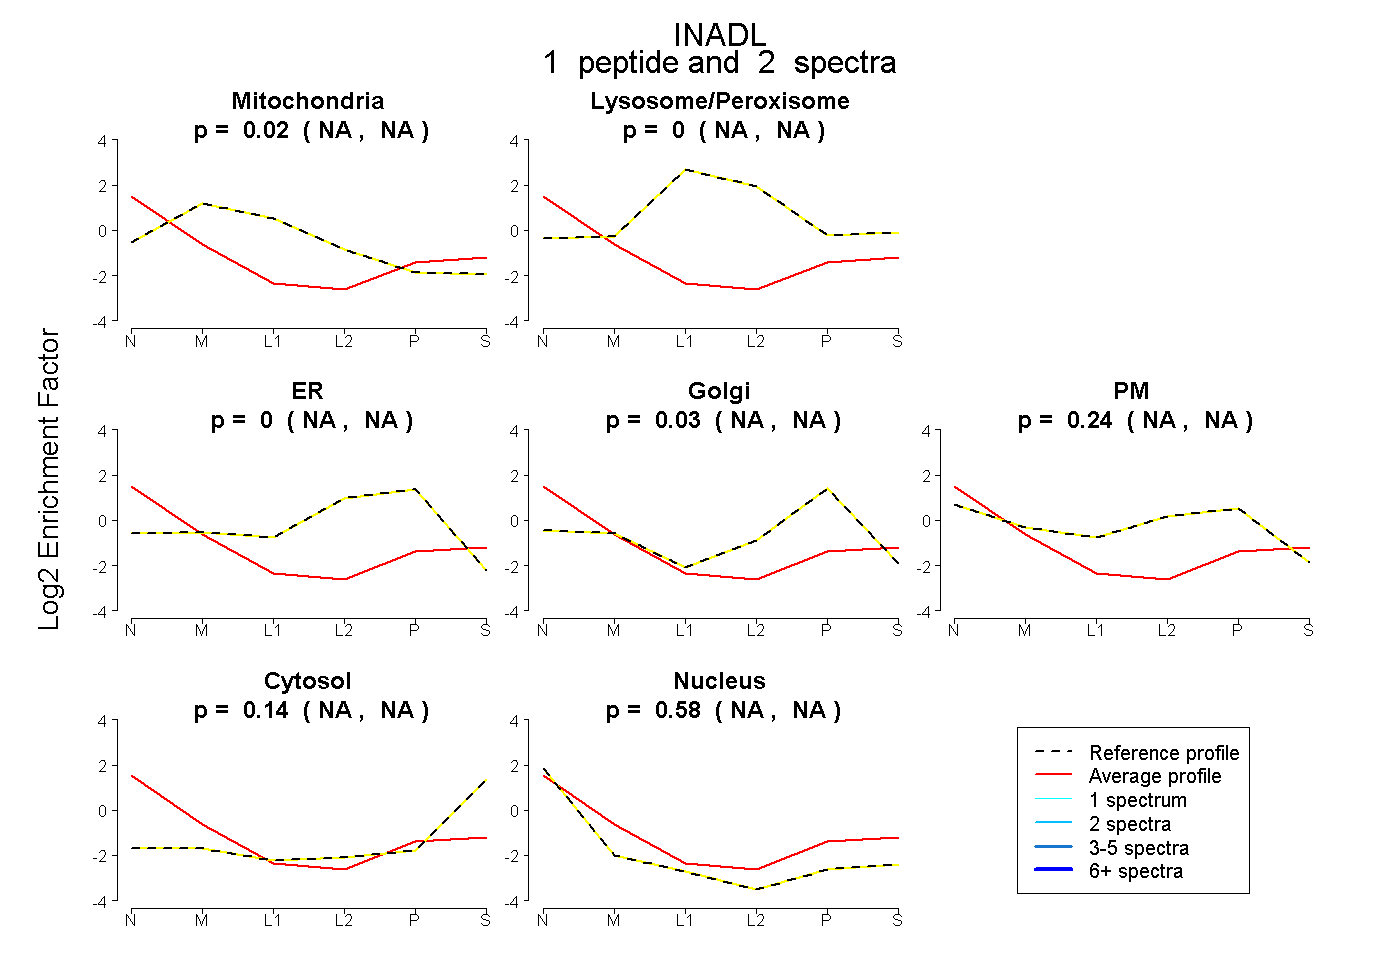 |
0.015 NA | NA |
0.000 NA | NA |
0.000 NA | NA |
0.027 NA | NA |
0.243 NA | NA |
0.136 NA | NA |
0.580 NA | NA |
|||
| Plot | Lyso | Other | |||||||||||
| Expt C |
2 peptides |
5 spectra |
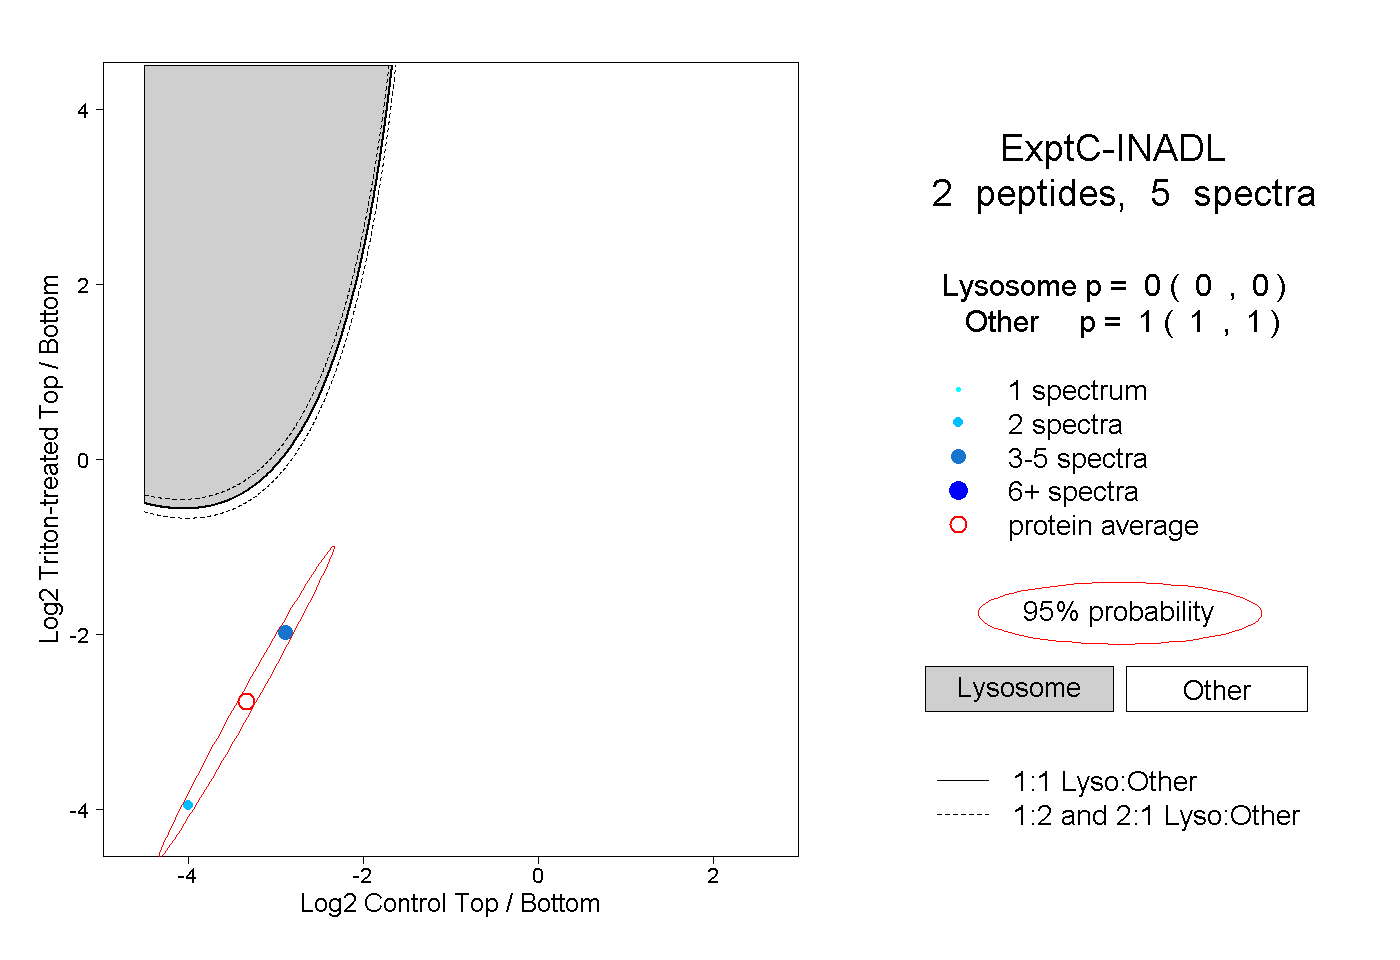 |
0.000 0.000 | 0.000 |
1.000 1.000 | 1.000 |