28
28peptides
spectra
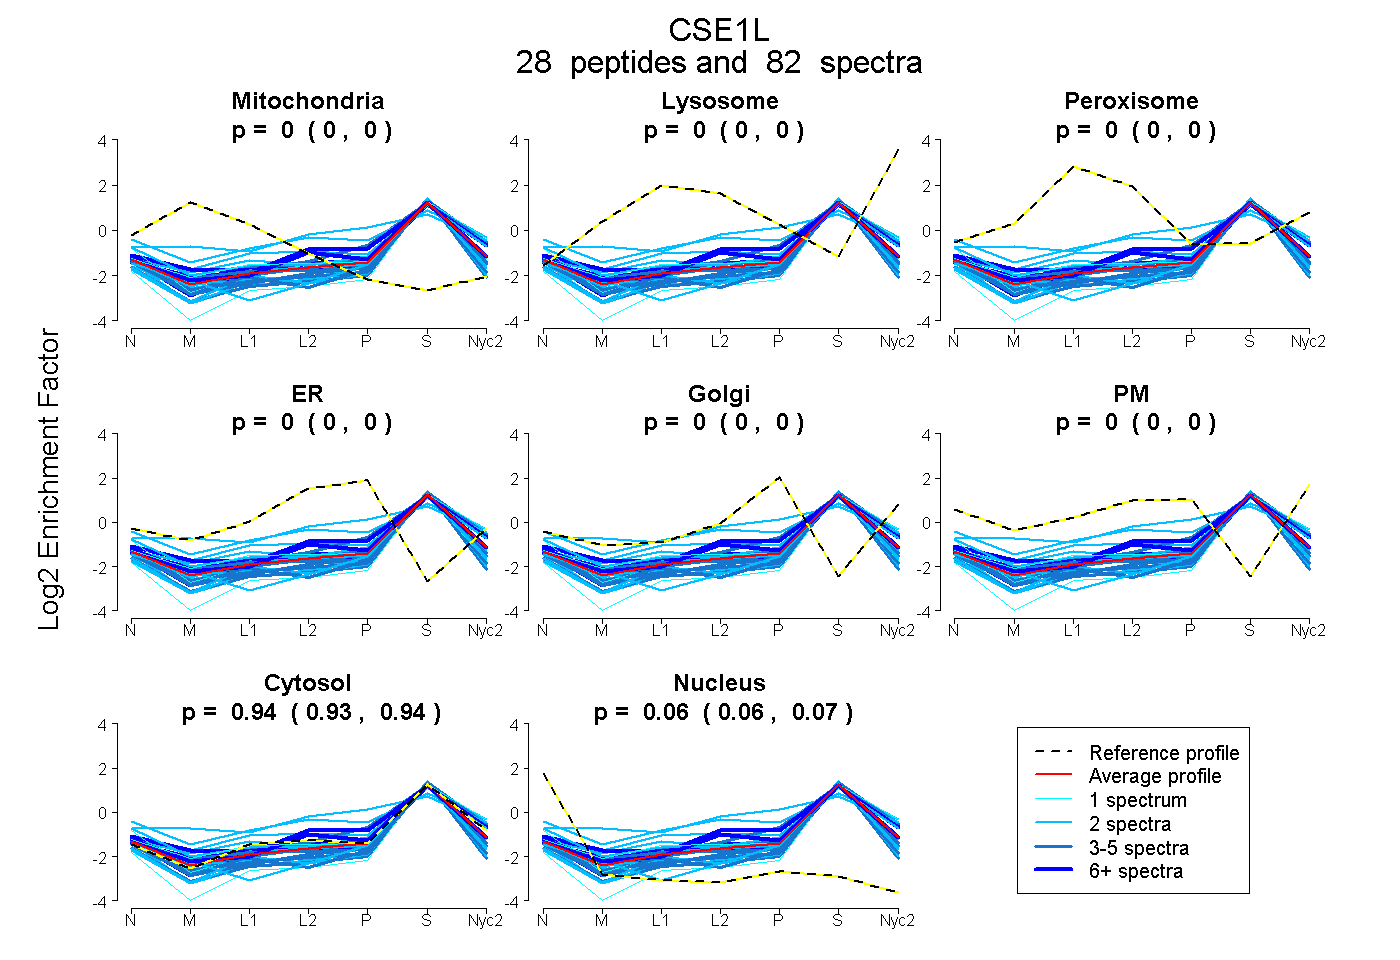
0.000 | 0.000
0.000 | 0.000
0.000 | 0.000
0.000 | 0.000
0.000 | 0.000
0.000 | 0.000
0.934 | 0.937
0.062 | 0.066
9peptides
spectra
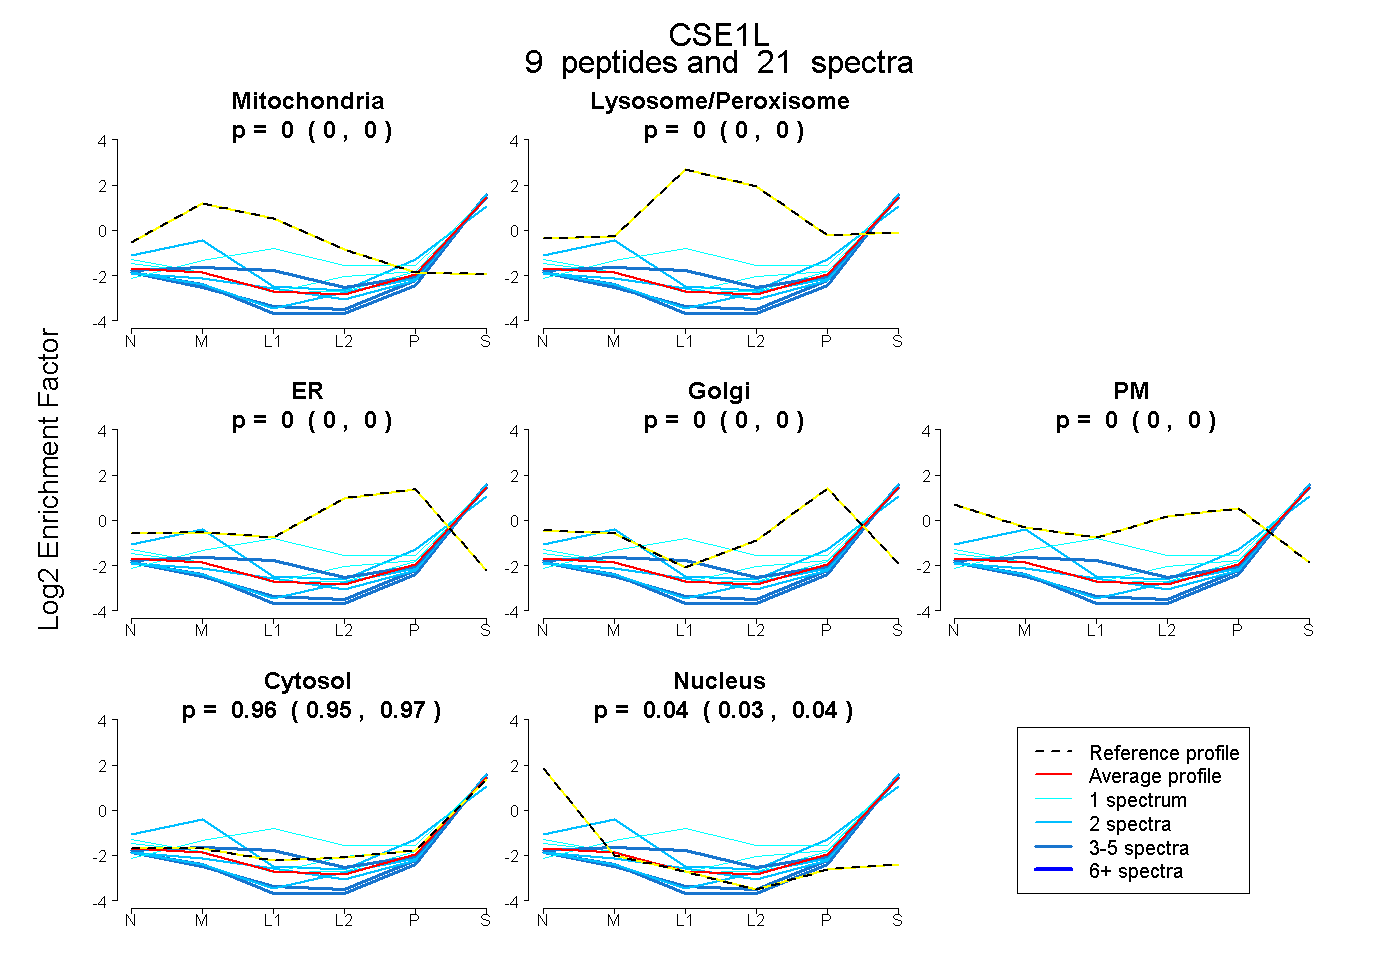
0.000 | 0.000
0.000 | 0.000
0.000 | 0.000
0.000 | 0.000
0.000 | 0.000
0.954 | 0.969
0.030 | 0.044
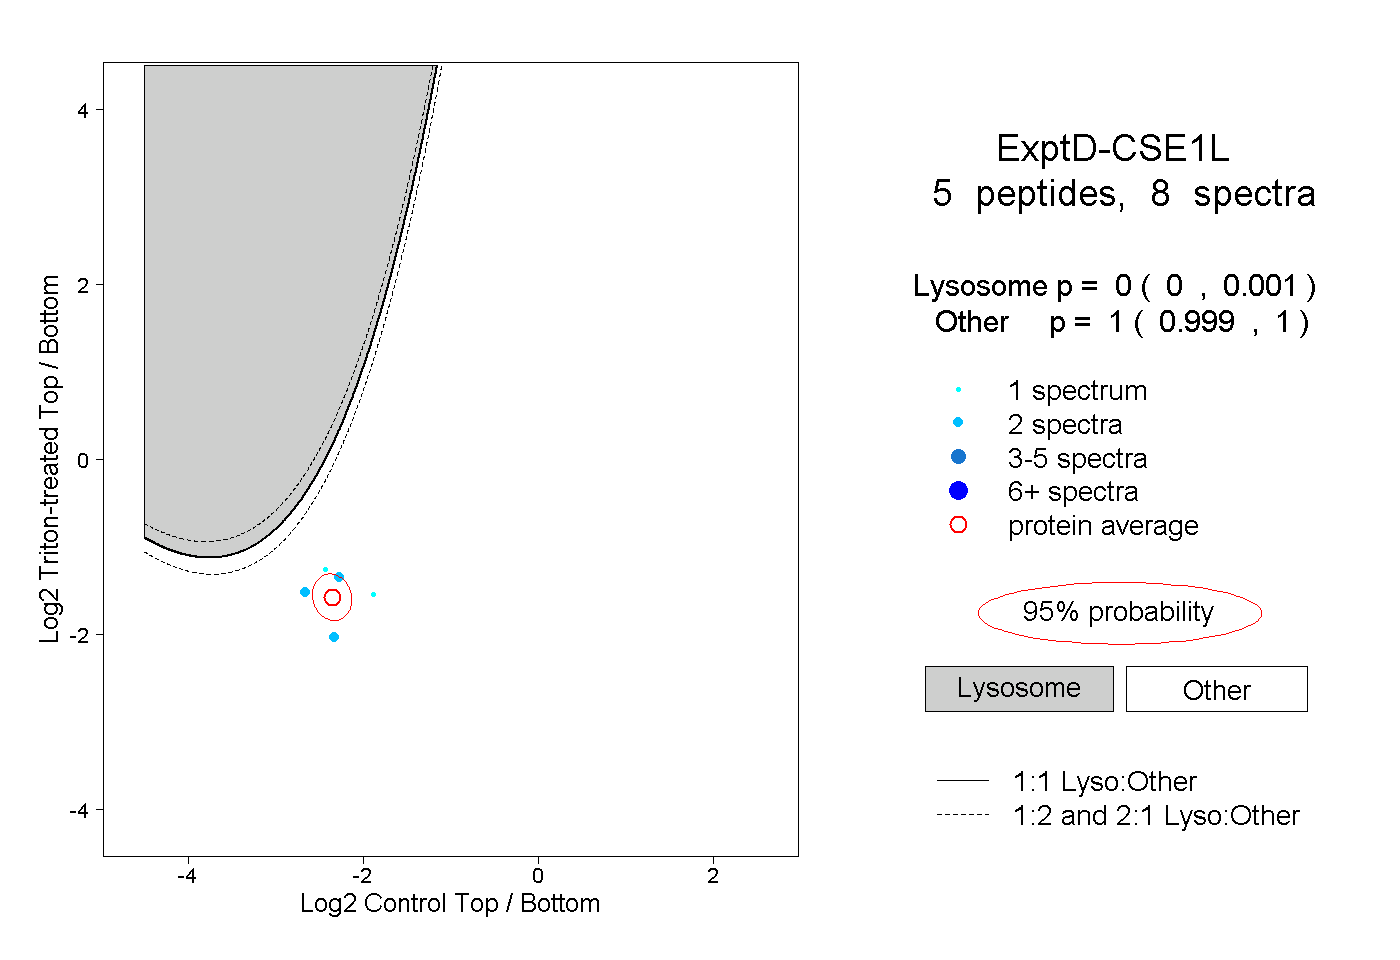
11peptides
spectra
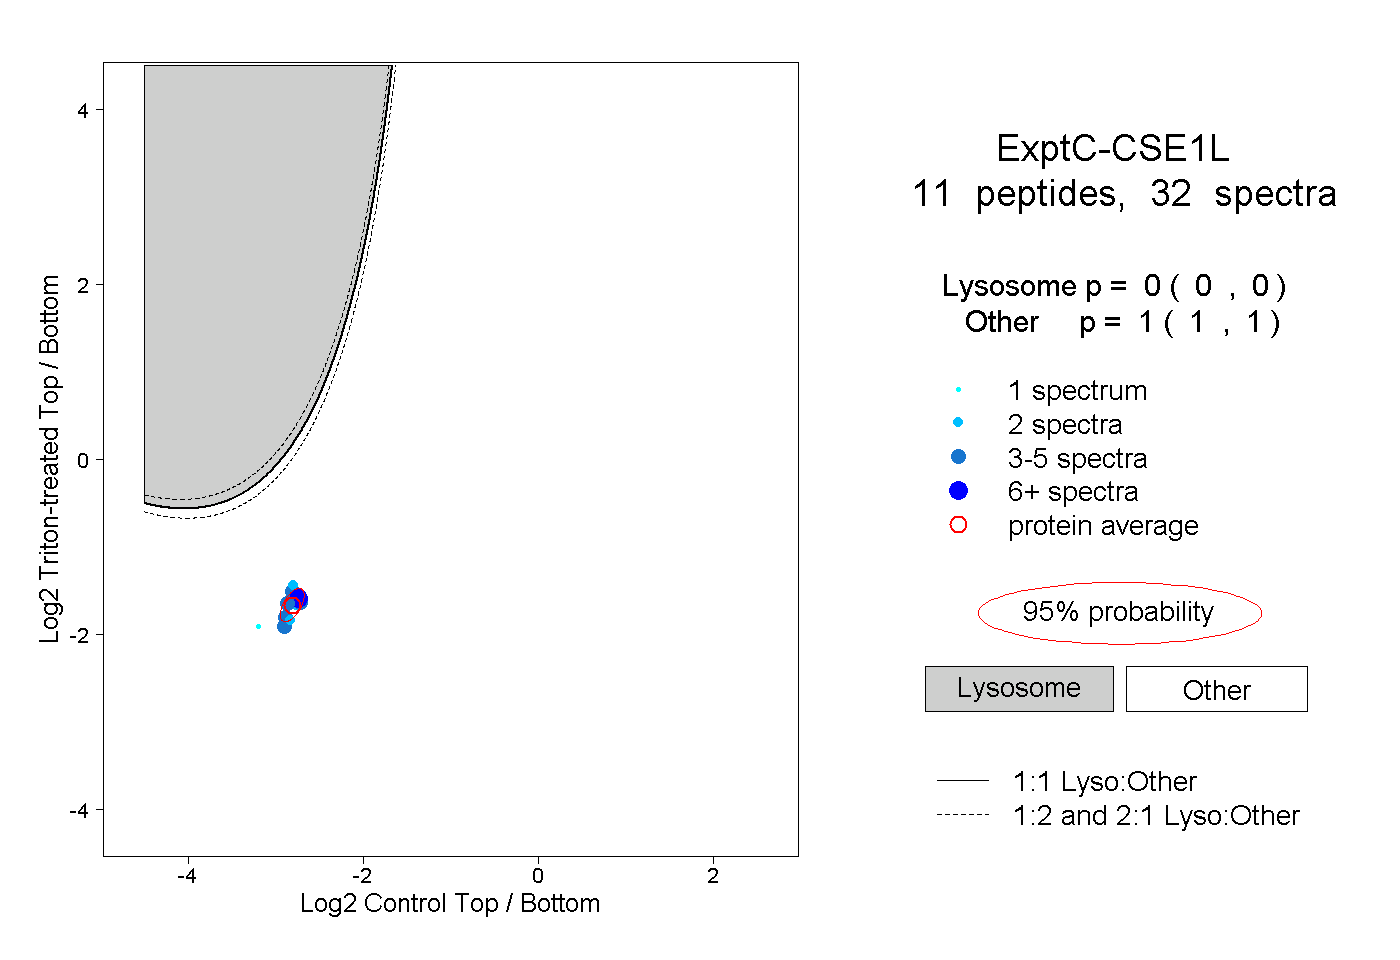
0.000 | 0.000
1.000 | 1.000