 12
12peptides
spectra
0.000 | 0.000
0.101 | 0.110
0.000 | 0.003
0.000 | 0.000
0.063 | 0.078
0.188 | 0.207
0.621 | 0.626
0.000 | 0.000
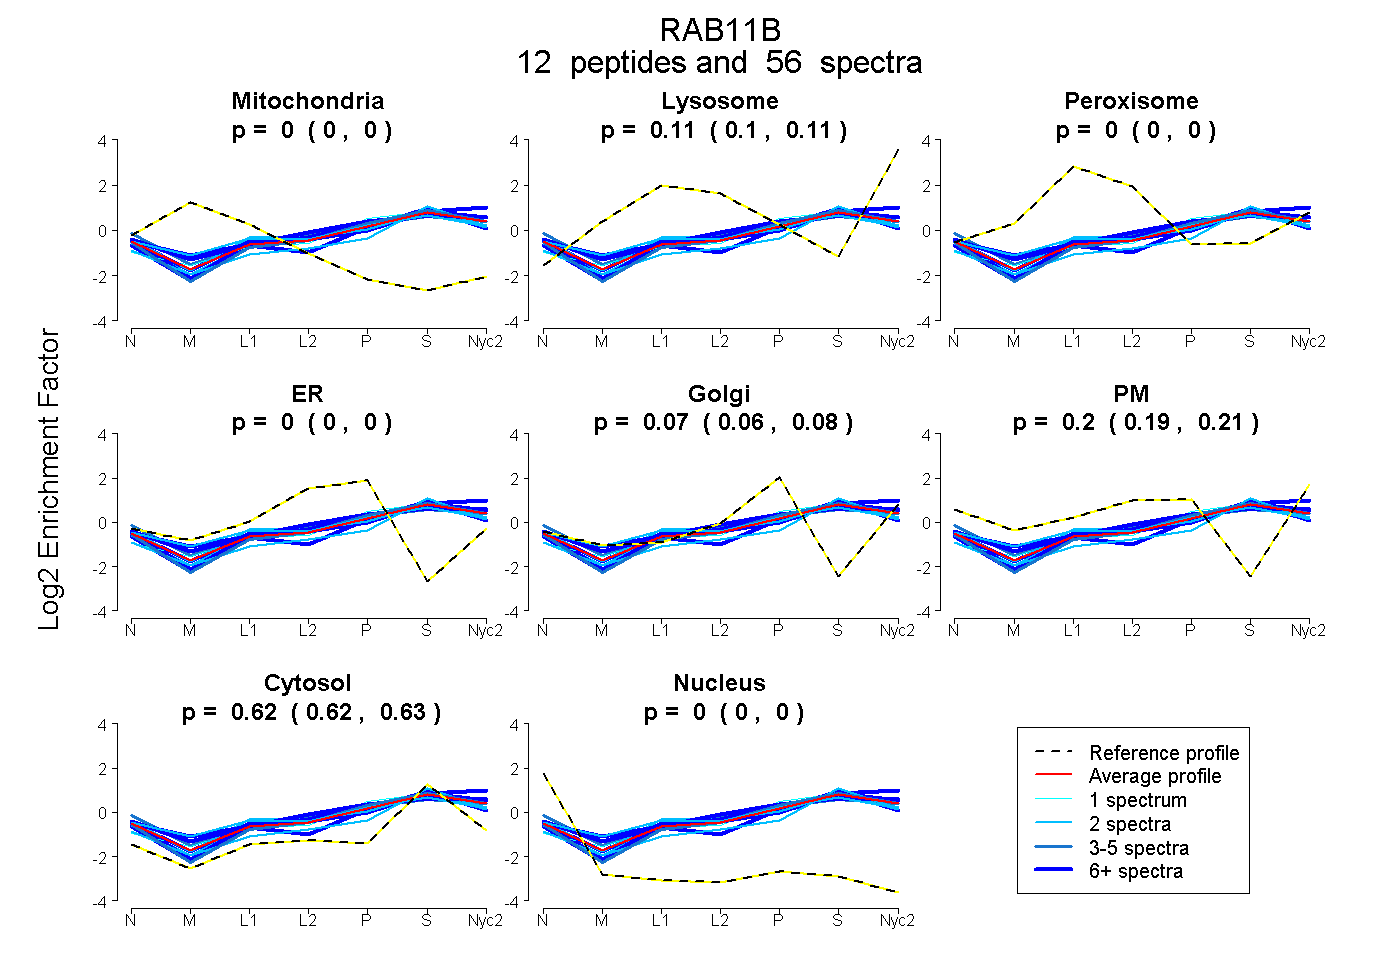
| Plot | Mito | Lyso | Perox | ER | Golgi | PM | Cytosol | Nucleus | |||||
| Expt A |
12 peptides |
56 spectra |
|
0.000 0.000 | 0.000 |
0.106 0.101 | 0.110 |
0.000 0.000 | 0.003 |
0.000 0.000 | 0.000 |
0.071 0.063 | 0.078 |
0.199 0.188 | 0.207 |
0.624 0.621 | 0.626 |
0.000 0.000 | 0.000 |
| 8 spectra, SNLLSR | 0.000 | 0.149 | 0.001 | 0.000 | 0.099 | 0.201 | 0.550 | 0.000 | ||
| 4 spectra, STIGVEFATR | 0.000 | 0.084 | 0.000 | 0.000 | 0.165 | 0.108 | 0.643 | 0.000 | ||
| 2 spectra, NILTEIYR | 0.000 | 0.098 | 0.000 | 0.000 | 0.077 | 0.066 | 0.758 | 0.000 | ||
| 6 spectra, AITSAYYR | 0.000 | 0.059 | 0.016 | 0.000 | 0.197 | 0.029 | 0.699 | 0.000 | ||
| 2 spectra, HLTYENVER | 0.000 | 0.004 | 0.148 | 0.000 | 0.072 | 0.173 | 0.603 | 0.000 | ||
| 2 spectra, VVLIGDSGVGK | 0.000 | 0.020 | 0.185 | 0.000 | 0.194 | 0.074 | 0.527 | 0.000 | ||
| 2 spectra, AQIWDTAGQER | 0.000 | 0.072 | 0.048 | 0.000 | 0.142 | 0.105 | 0.633 | 0.000 | ||
| 4 spectra, AVPTDEAR | 0.000 | 0.008 | 0.024 | 0.000 | 0.000 | 0.399 | 0.568 | 0.000 | ||
| 7 spectra, GAVGALLVYDIAK | 0.000 | 0.122 | 0.000 | 0.000 | 0.000 | 0.245 | 0.634 | 0.000 | ||
| 9 spectra, NEFNLESK | 0.000 | 0.114 | 0.014 | 0.000 | 0.077 | 0.254 | 0.542 | 0.000 | ||
| 9 spectra, DDEYDYLFK | 0.000 | 0.146 | 0.000 | 0.000 | 0.000 | 0.234 | 0.620 | 0.000 | ||
| 1 spectrum, DHADSNIVIMLVGNK | 0.000 | 0.178 | 0.000 | 0.000 | 0.239 | 0.000 | 0.582 | 0.000 |
| Plot | Mito | Lyso or Perox | ER | Golgi | PM | Cytosol | Nucleus | ||||||
| Expt B |
7 peptides |
26 spectra |
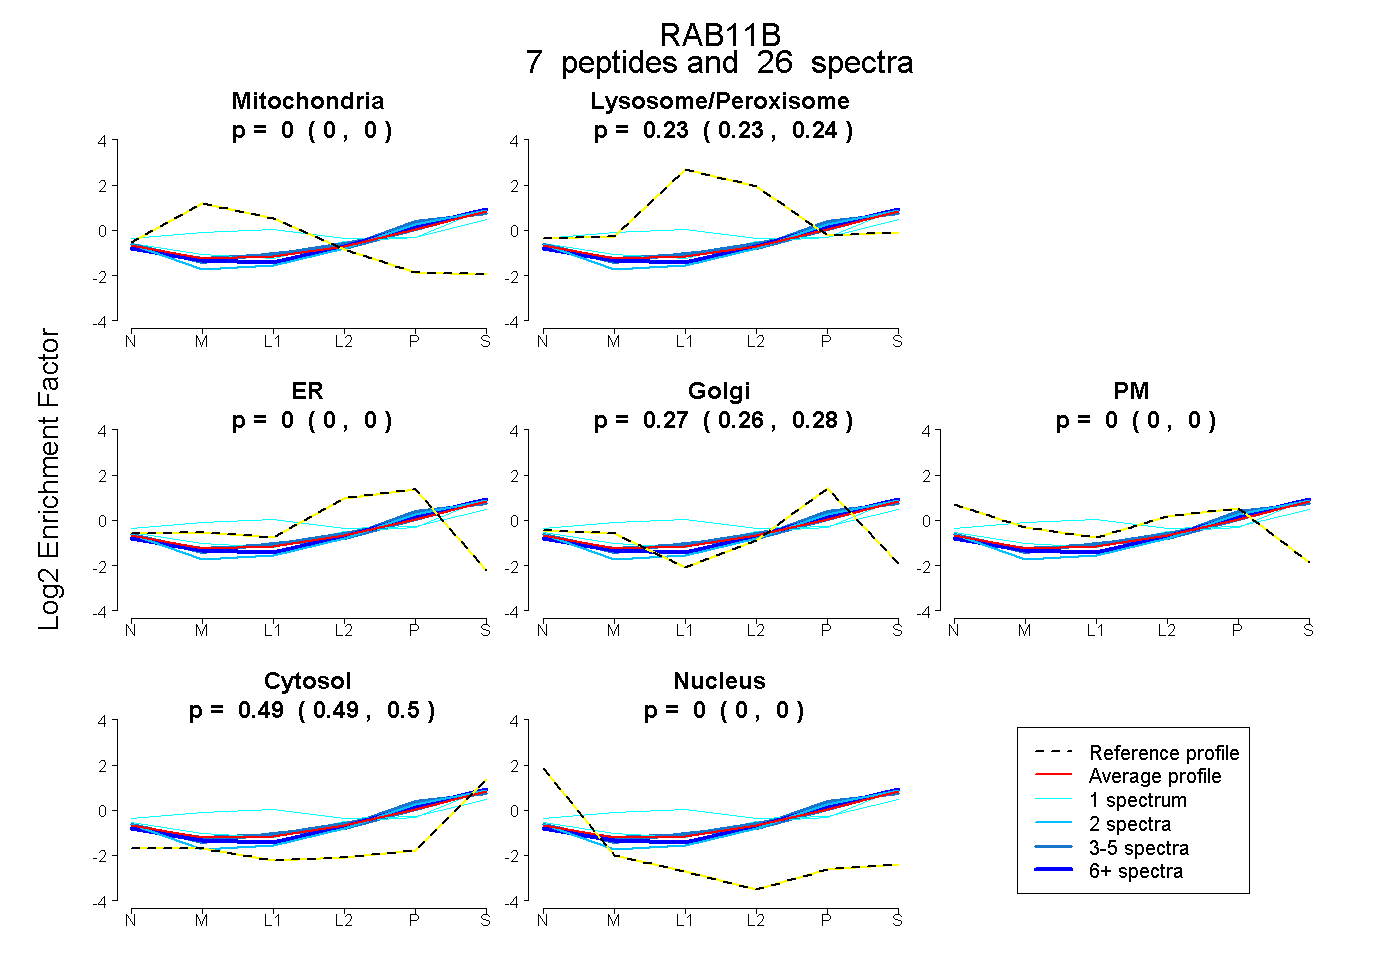 |
0.000 0.000 | 0.000 |
0.235 0.228 | 0.240 |
0.000 0.000 | 0.000 |
0.272 0.265 | 0.279 |
0.000 0.000 | 0.000 |
0.493 0.487 | 0.498 |
0.000 0.000 | 0.000 |
|||
| Plot | Lyso | Other | |||||||||||
| Expt C |
12 peptides |
82 spectra |
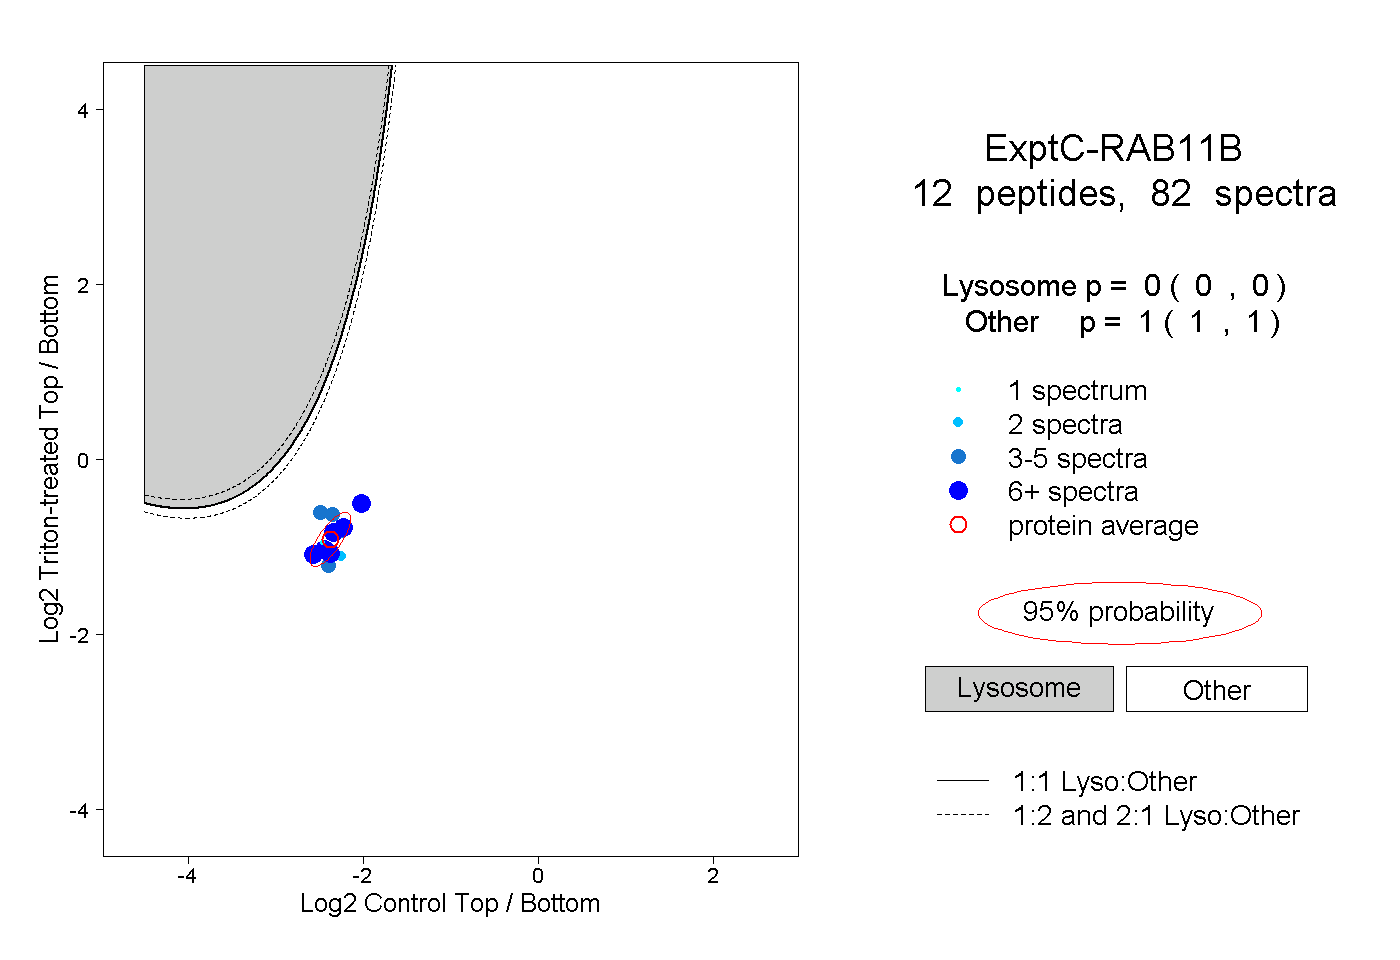 |
0.000 0.000 | 0.000 |
1.000 1.000 | 1.000 |
||||||||
| Plot | Lyso | Other | |||||||||||
| Expt D |
4 peptides |
16 spectra |
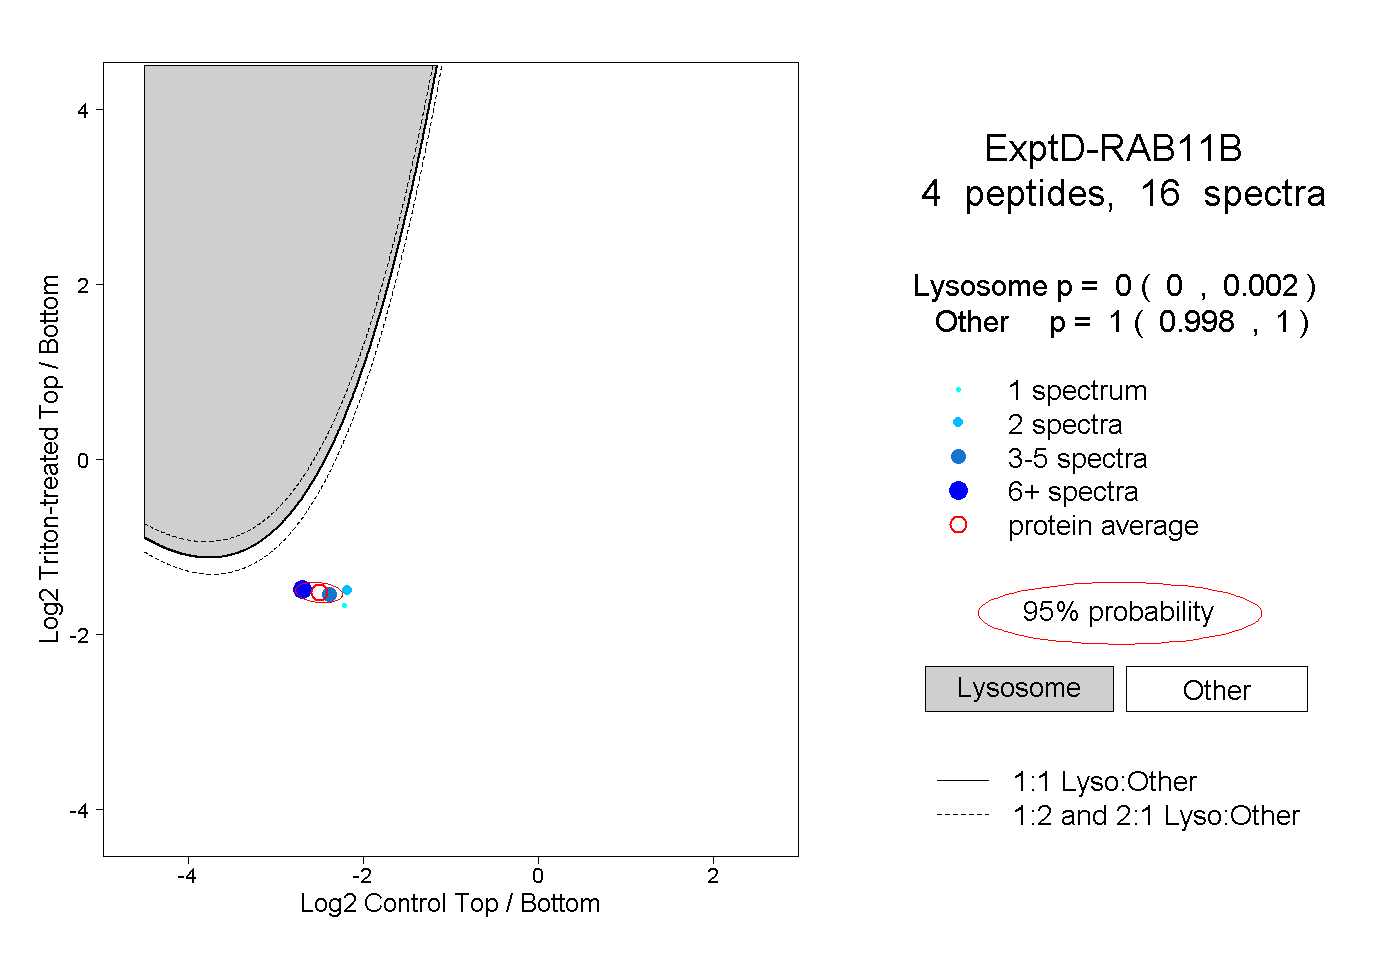 |
0.000 0.000 | 0.002 |
1.000 0.998 | 1.000 |