 2
2peptides
spectra
0.000 | 0.000
0.553 | 0.797
0.000 | 0.201
0.000 | 0.000
0.000 | 0.000
0.081 | 0.209
0.027 | 0.095
0.000 | 0.000
3peptides
spectra
0.099 | 1.000
0.000 | 0.894
| Plot | Mito | Lyso | Perox | ER | Golgi | PM | Cytosol | Nucleus | |||||
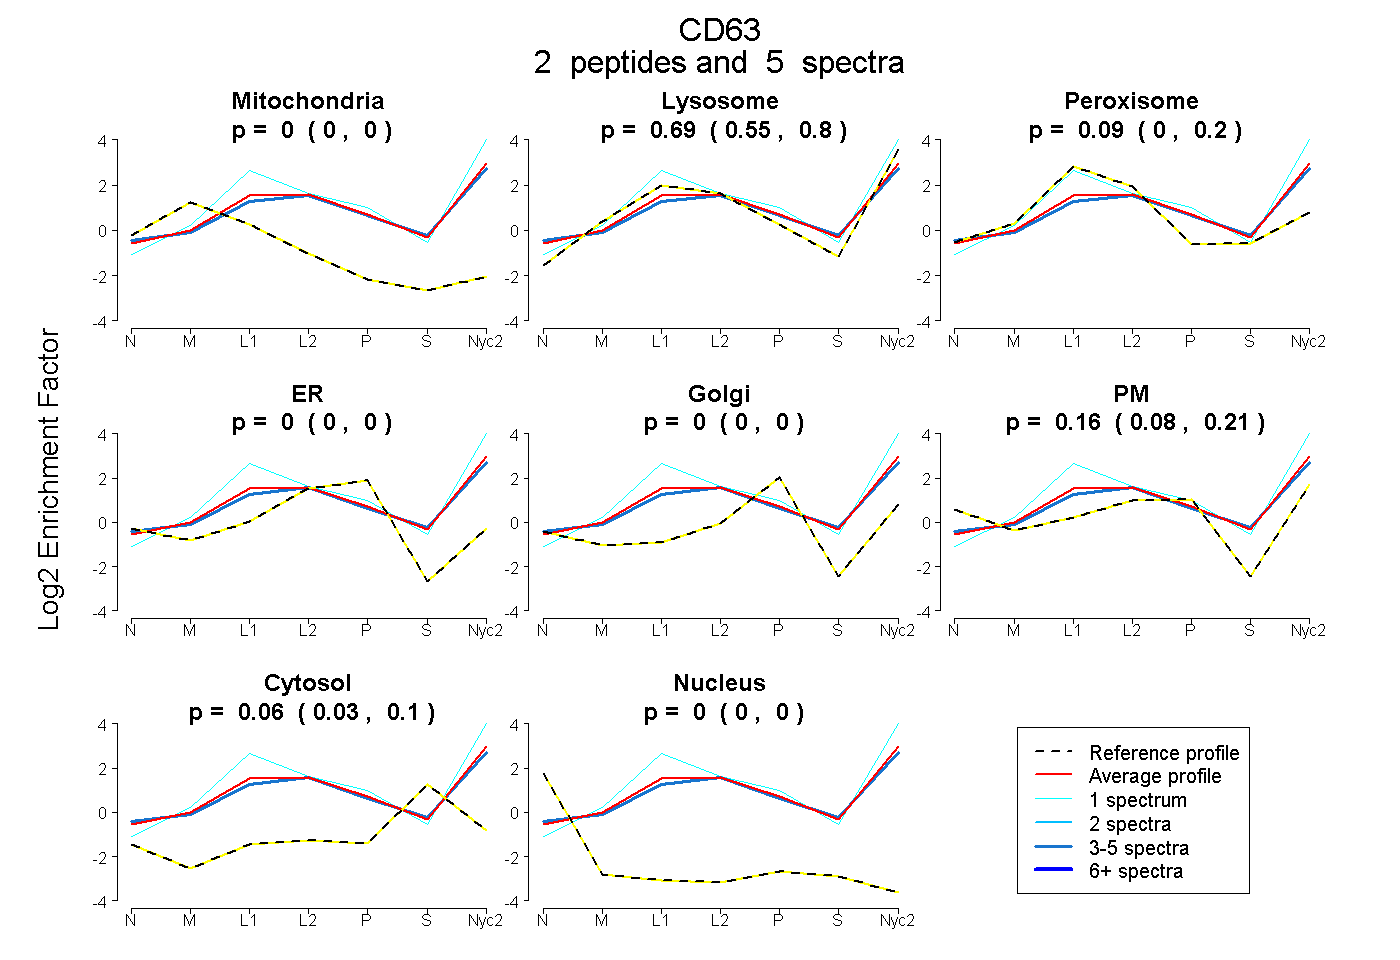
| Expt A |
2 peptides |
5 spectra |
|
0.000 0.000 | 0.000 |
0.691 0.553 | 0.797 |
0.089 0.000 | 0.201 |
0.000 0.000 | 0.000 |
0.000 0.000 | 0.000 |
0.156 0.081 | 0.209 |
0.064 0.027 | 0.095 |
0.000 0.000 | 0.000 |
||
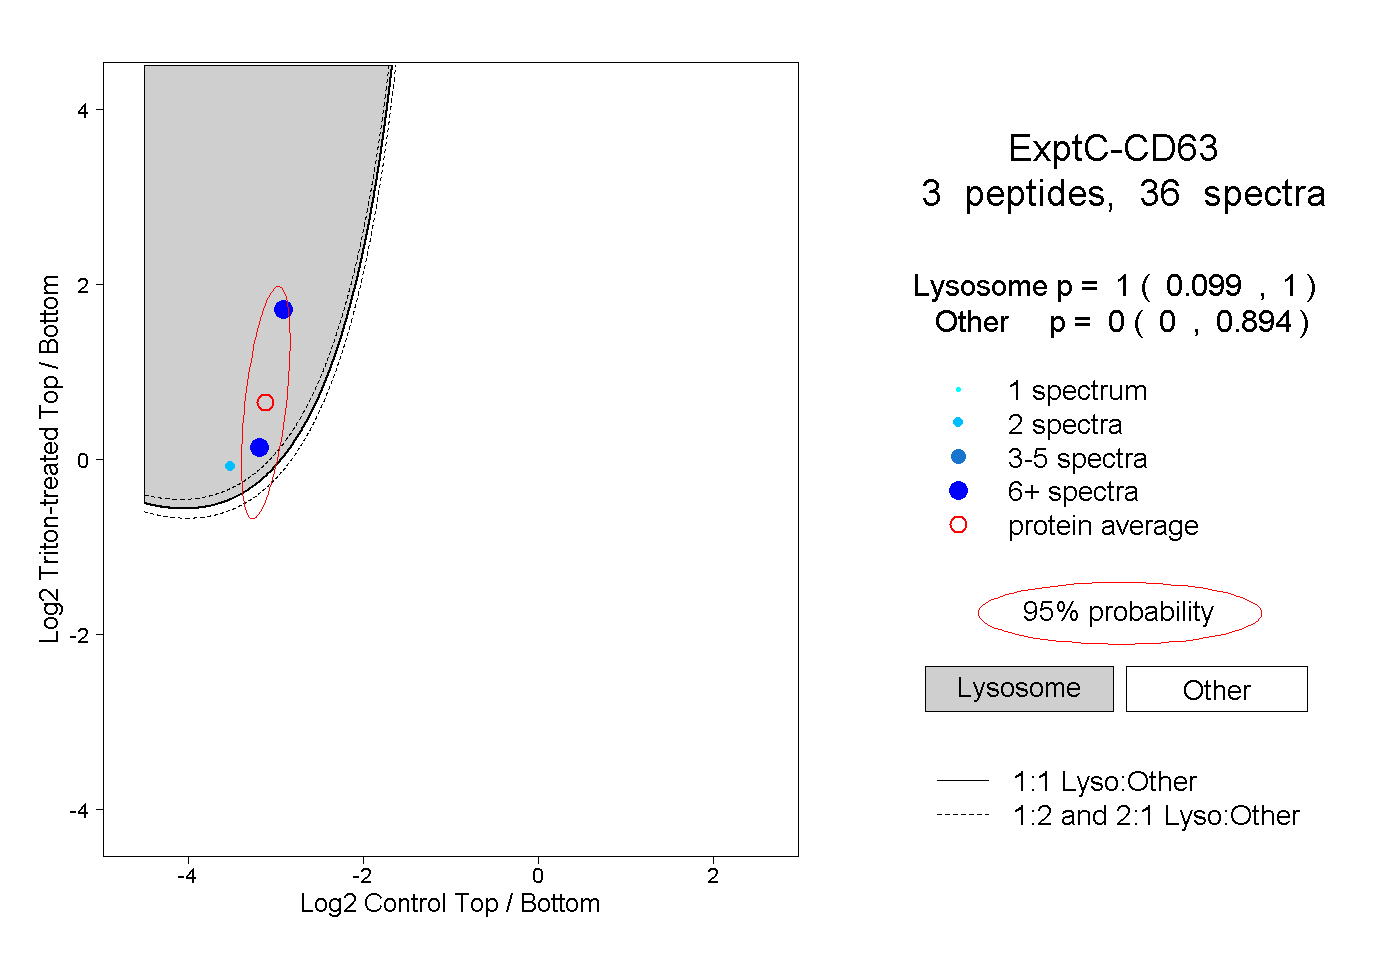
| Plot | Lyso | Other | |||||||||||
| Expt C |
3 peptides |
36 spectra |
|
1.000 0.099 | 1.000 |
0.000 0.000 | 0.894 |