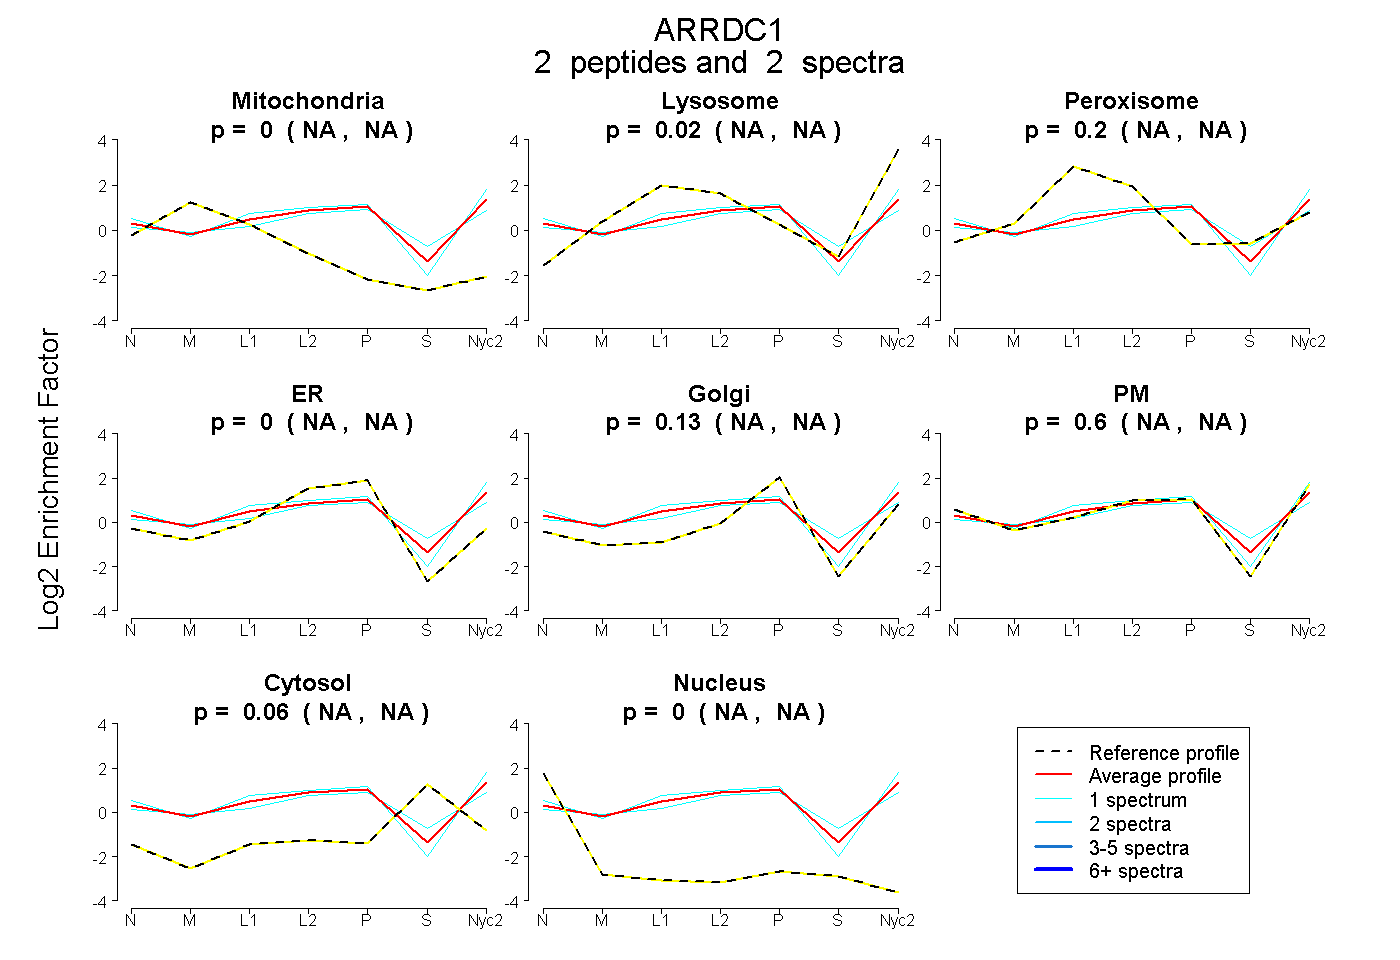
 2
2peptides
spectra
NA | NA
NA | NA
NA | NA
NA | NA
NA | NA
NA | NA
NA | NA
NA | NA
| Plot | Mito | Lyso | Perox | ER | Golgi | PM | Cytosol | Nucleus | |||||
| Expt A |
2 peptides |
2 spectra |
|
0.000 NA | NA |
0.019 NA | NA |
0.199 NA | NA |
0.000 NA | NA |
0.127 NA | NA |
0.597 NA | NA |
0.057 NA | NA |
0.000 NA | NA |
| 1 spectrum, LGAPLPFR | 0.000 | 0.070 | 0.091 | 0.000 | 0.000 | 0.839 | 0.000 | 0.000 | ||
| 1 spectrum, IVHQVR | 0.000 | 0.000 | 0.262 | 0.000 | 0.208 | 0.385 | 0.145 | 0.000 |
| Plot | Lyso | Other | |||||||||||
| Expt C |
3 peptides |
4 spectra |
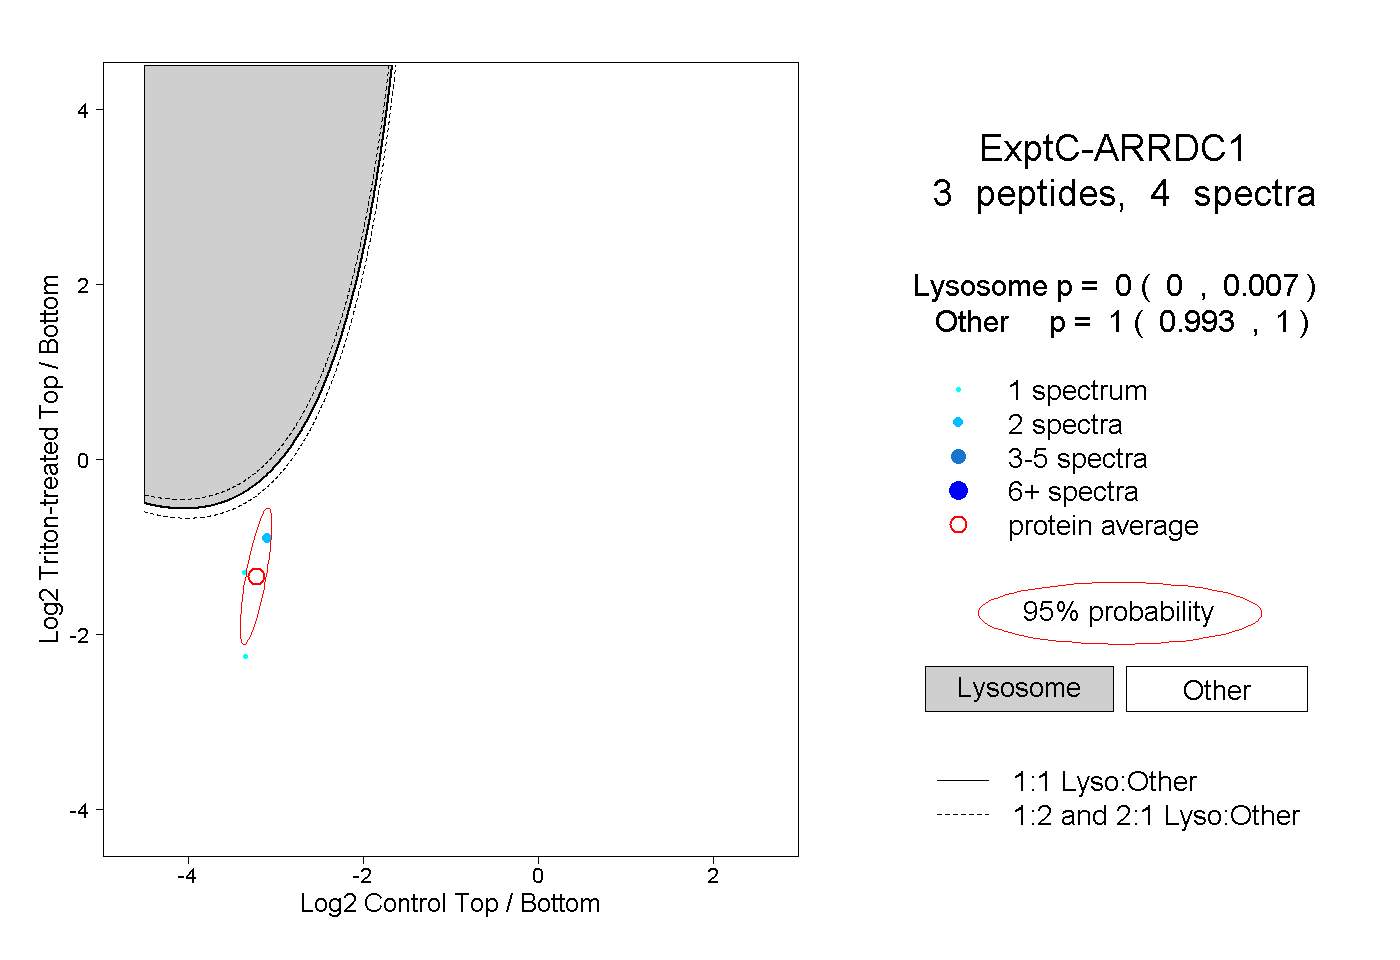 |
0.000 0.000 | 0.007 |
1.000 0.993 | 1.000 |