 3
3peptides
spectra
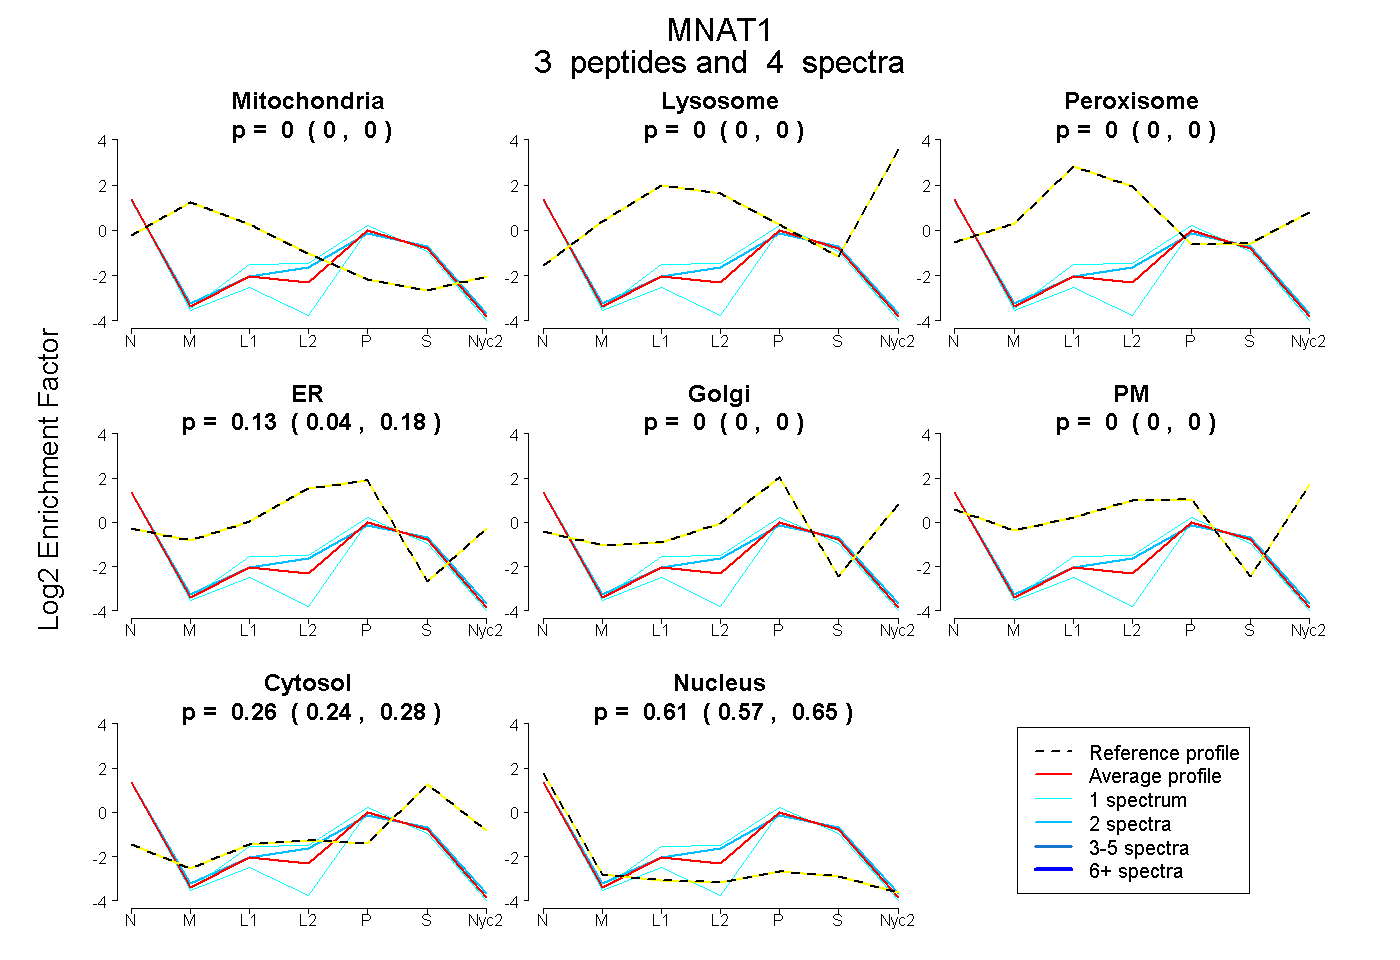
0.000 | 0.000
0.000 | 0.000
0.000 | 0.000
0.044 | 0.175
0.000 | 0.005
0.000 | 0.000
0.238 | 0.282
0.568 | 0.647
| Plot | Mito | Lyso | Perox | ER | Golgi | PM | Cytosol | Nucleus | |||||
| Expt A |
3 peptides |
4 spectra |
|
0.000 0.000 | 0.000 |
0.000 0.000 | 0.000 |
0.000 0.000 | 0.000 |
0.127 0.044 | 0.175 |
0.000 0.000 | 0.005 |
0.000 0.000 | 0.000 |
0.263 0.238 | 0.282 |
0.610 0.568 | 0.647 |