 1
1peptide
spectra
0.000 | 0.000
0.000 | 0.012
0.000 | 0.000
0.000 | 0.044
0.686 | 0.750
0.240 | 0.263
0.000 | 0.012
1peptide
spectra
NA | NA
NA | NA
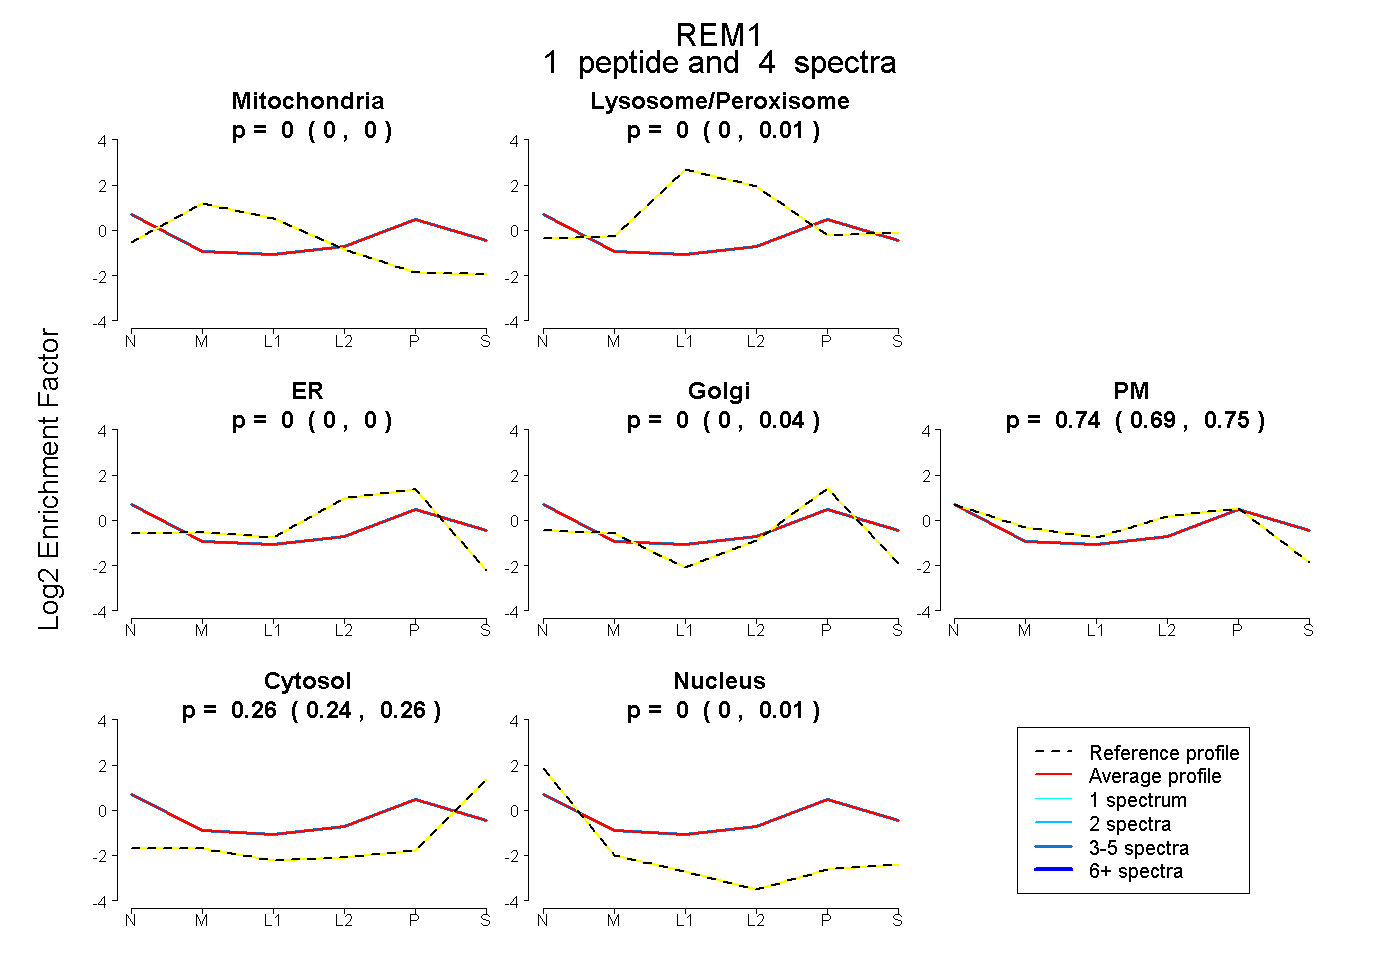
| Plot | Mito | Lyso or Perox | ER | Golgi | PM | Cytosol | Nucleus | ||||||
| Expt B |
1 peptide |
4 spectra |
|
0.000 0.000 | 0.000 |
0.000 0.000 | 0.012 |
0.000 0.000 | 0.000 |
0.005 0.000 | 0.044 |
0.740 0.686 | 0.750 |
0.255 0.240 | 0.263 |
0.000 0.000 | 0.012 |
|||
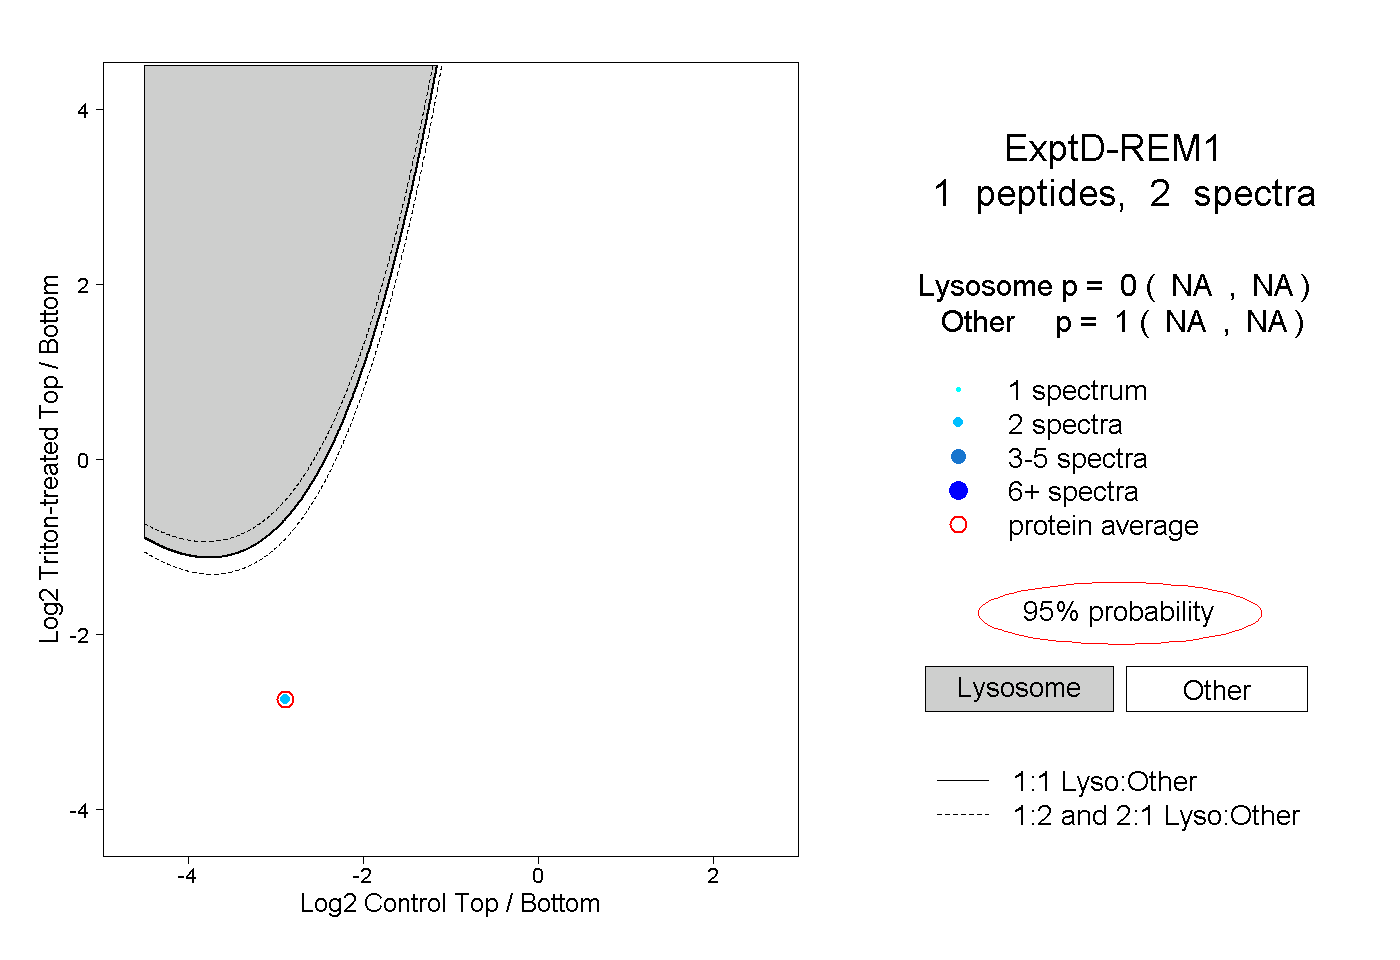
| Plot | Lyso | Other | |||||||||||
| Expt D |
1 peptide |
2 spectra |
|
0.000 NA | NA |
1.000 NA | NA |