 2
2peptides
spectra
0.000 | 0.074
0.162 | 0.411
0.000 | 0.580
0.000 | 0.522
0.000 | 0.471
0.000 | 0.261
0.000 | 0.124
1peptide
spectrum
NA | NA
NA | NA
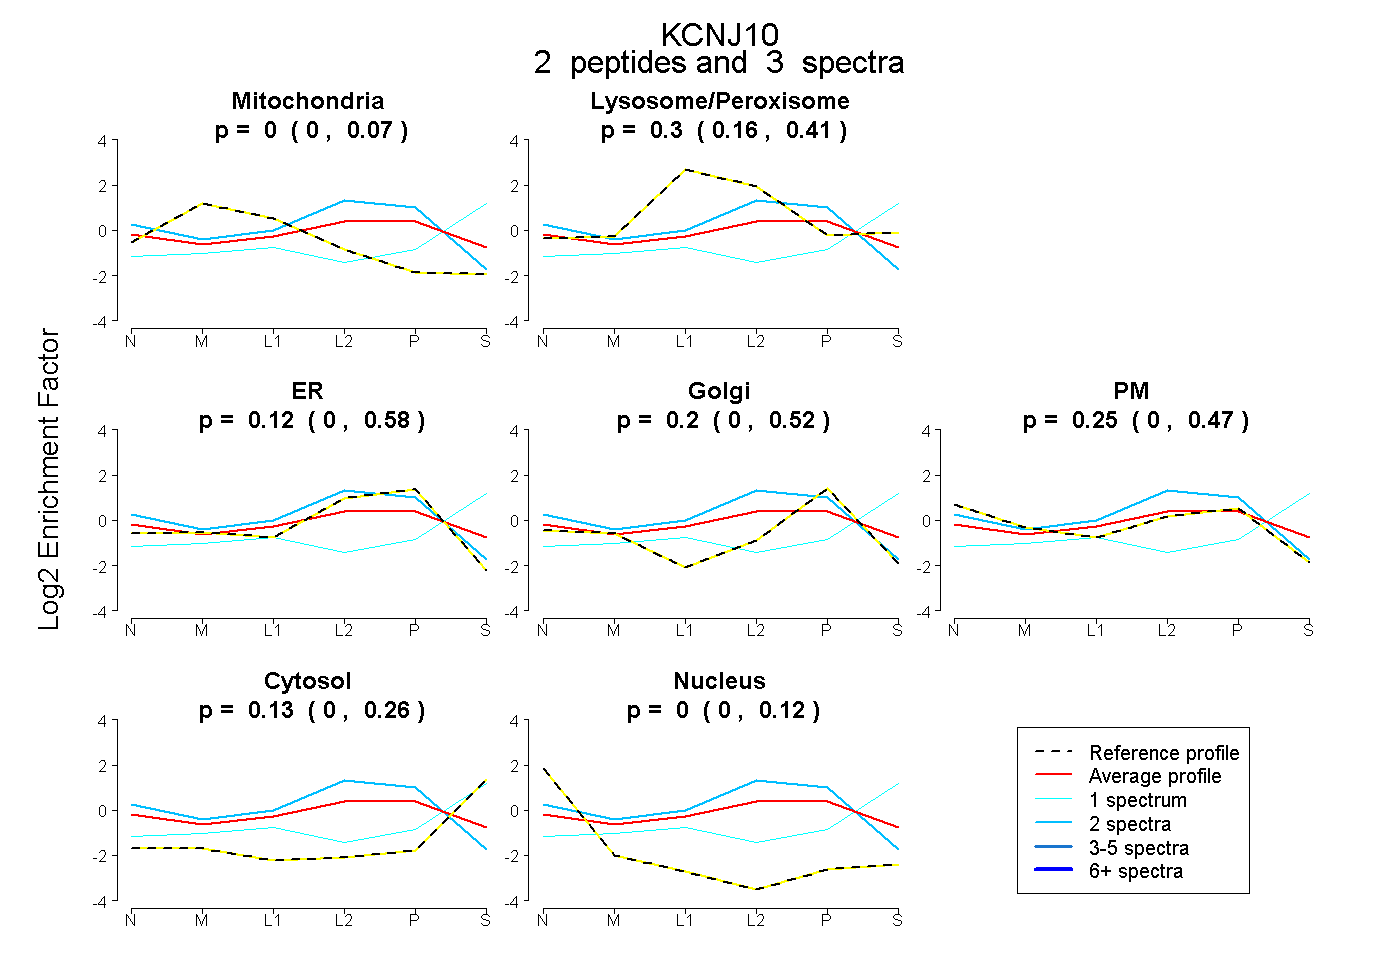
| Plot | Mito | Lyso or Perox | ER | Golgi | PM | Cytosol | Nucleus | ||||||
| Expt B |
2 peptides |
3 spectra |
|
0.000 0.000 | 0.074 |
0.303 0.162 | 0.411 |
0.118 0.000 | 0.580 |
0.198 0.000 | 0.522 |
0.248 0.000 | 0.471 |
0.133 0.000 | 0.261 |
0.000 0.000 | 0.124 |
|||
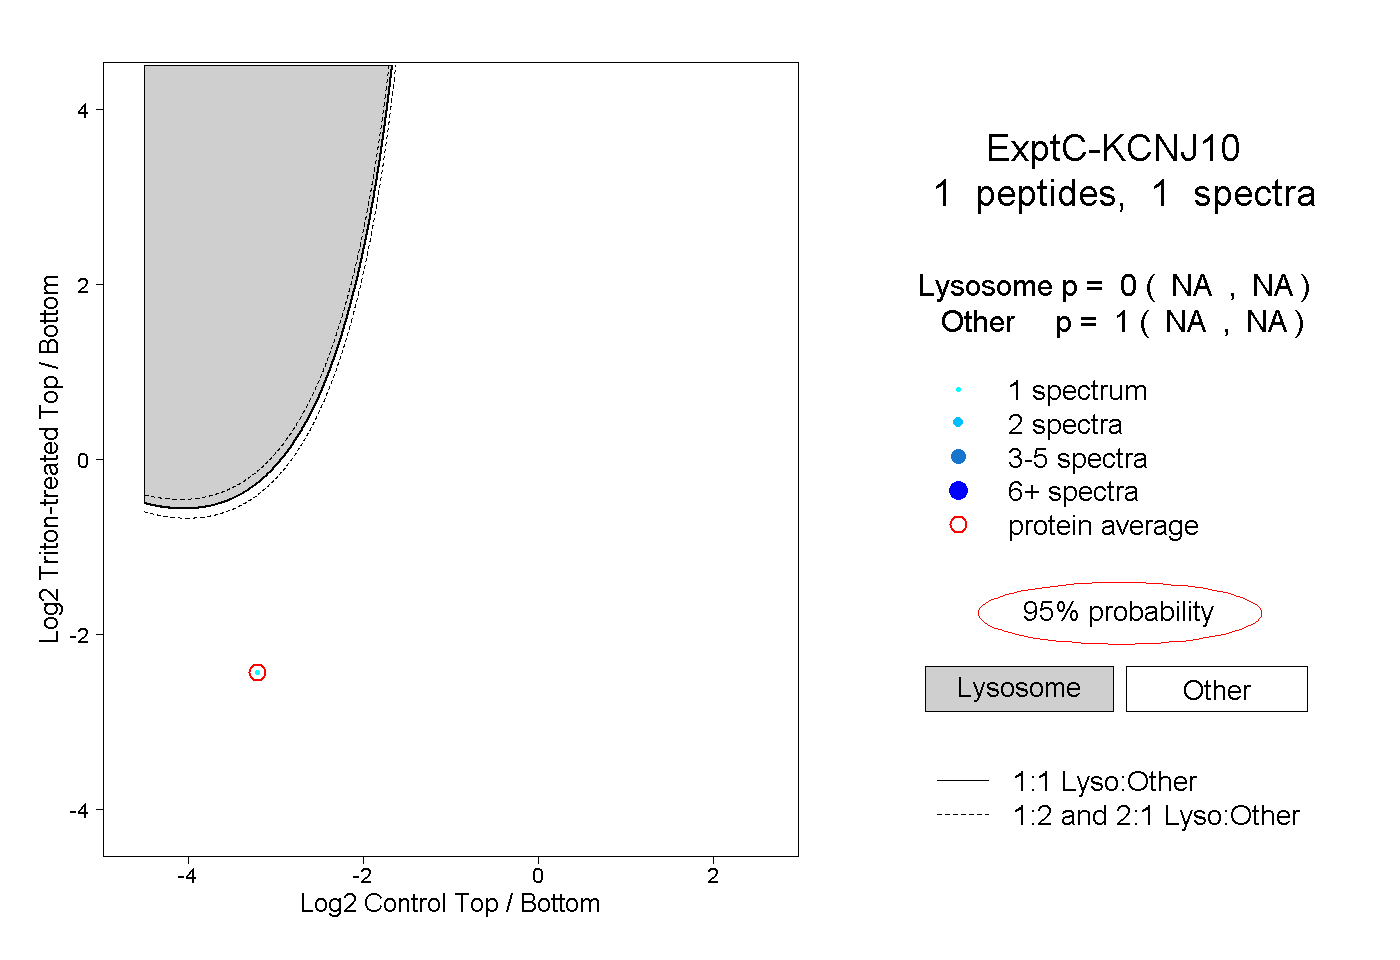
| Plot | Lyso | Other | |||||||||||
| Expt C |
1 peptide |
1 spectrum |
|
0.000 NA | NA |
1.000 NA | NA |