 7
7peptides
spectra
0.000 | 0.000
0.000 | 0.002
0.000 | 0.000
0.000 | 0.000
0.061 | 0.084
0.000 | 0.000
0.913 | 0.937
0.000 | 0.000
| Plot | Mito | Lyso | Perox | ER | Golgi | PM | Cytosol | Nucleus | |||||
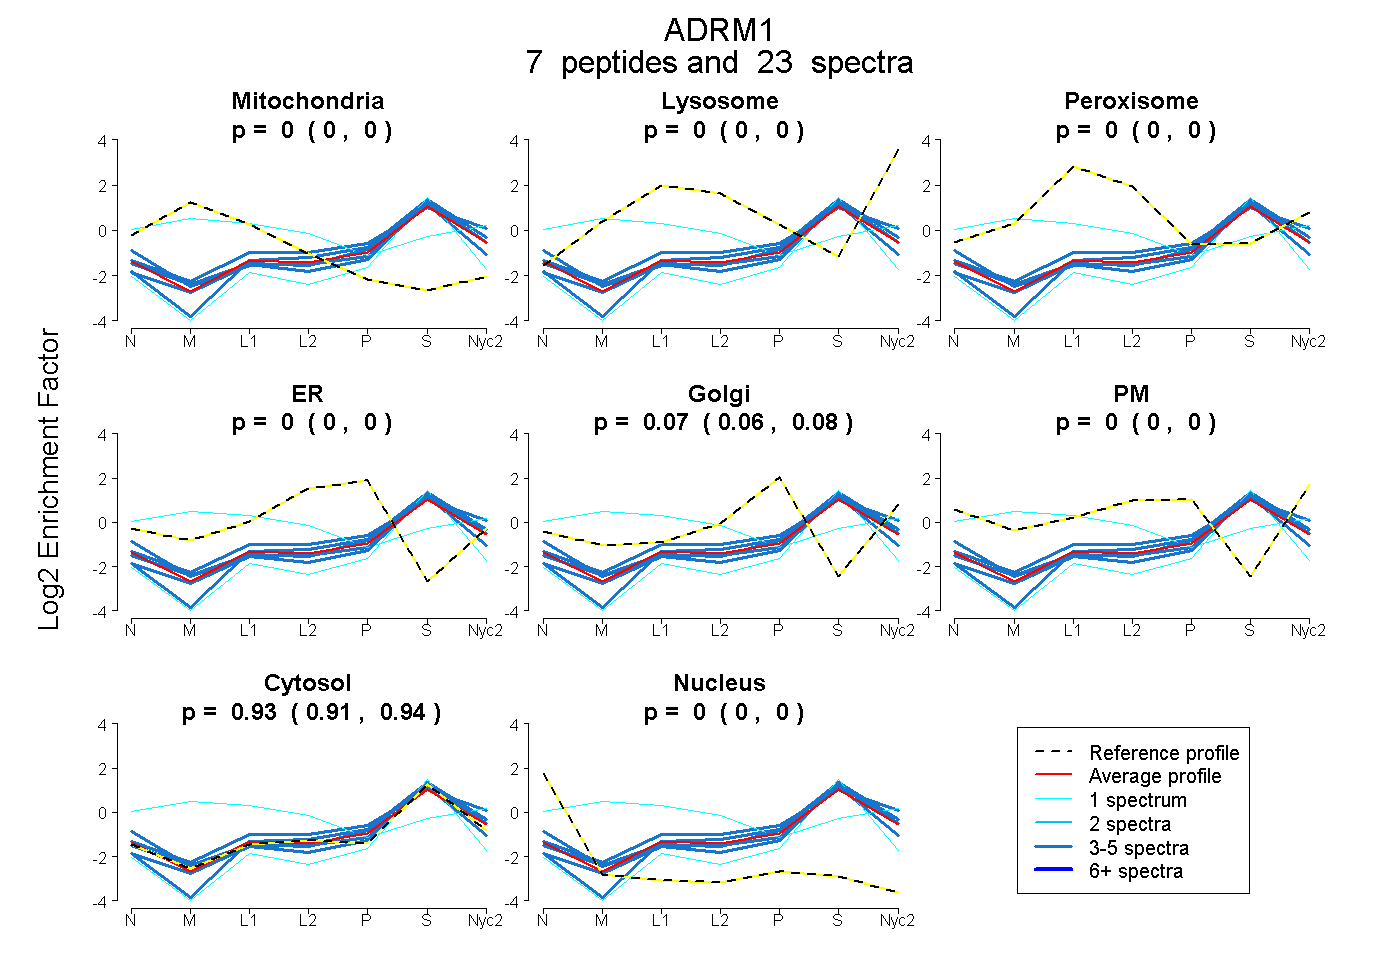
| Expt A |
7 peptides |
23 spectra |
|
0.000 0.000 | 0.000 |
0.000 0.000 | 0.002 |
0.000 0.000 | 0.000 |
0.000 0.000 | 0.000 |
0.074 0.061 | 0.084 |
0.000 0.000 | 0.000 |
0.926 0.913 | 0.937 |
0.000 0.000 | 0.000 |
| 1 spectrum, SQSAAVTPSSTTSSAR | 0.303 | 0.103 | 0.235 | 0.000 | 0.000 | 0.099 | 0.260 | 0.000 | ||
| 3 spectra, LFFWMQEPK | 0.000 | 0.118 | 0.000 | 0.000 | 0.076 | 0.000 | 0.806 | 0.000 | ||
| 5 spectra, AMQNNAK | 0.000 | 0.000 | 0.000 | 0.000 | 0.011 | 0.000 | 0.989 | 0.000 | ||
| 3 spectra, VPQCPSGR | 0.000 | 0.000 | 0.000 | 0.000 | 0.000 | 0.000 | 1.000 | 0.000 | ||
| 5 spectra, GDVEAFAK | 0.000 | 0.000 | 0.000 | 0.000 | 0.024 | 0.000 | 0.908 | 0.068 | ||
| 5 spectra, YLVEFR | 0.000 | 0.000 | 0.000 | 0.000 | 0.074 | 0.000 | 0.926 | 0.000 | ||
| 1 spectrum, GLVYIQQTDDSLIHFCWK | 0.000 | 0.000 | 0.000 | 0.000 | 0.000 | 0.000 | 0.925 | 0.075 |
| Plot | Mito | Lyso or Perox | ER | Golgi | PM | Cytosol | Nucleus | ||||||
| Expt B |
3 peptides |
6 spectra |
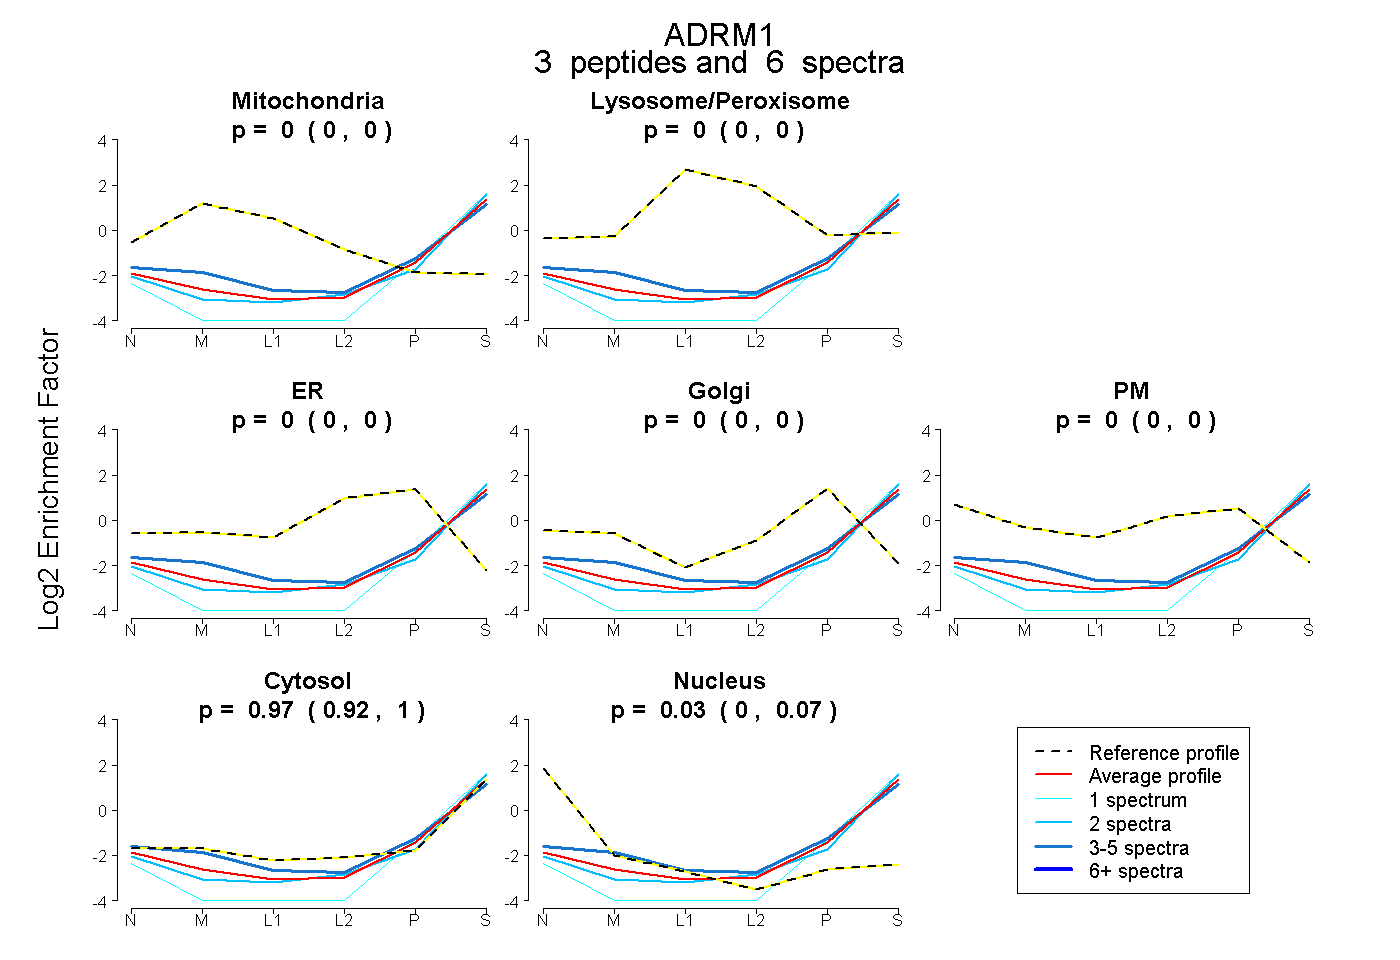 |
0.000 0.000 | 0.000 |
0.000 0.000 | 0.000 |
0.000 0.000 | 0.000 |
0.000 0.000 | 0.000 |
0.000 0.000 | 0.000 |
0.966 0.924 | 1.000 |
0.034 0.000 | 0.069 |
|||
| Plot | Lyso | Other | |||||||||||
| Expt C |
5 peptides |
20 spectra |
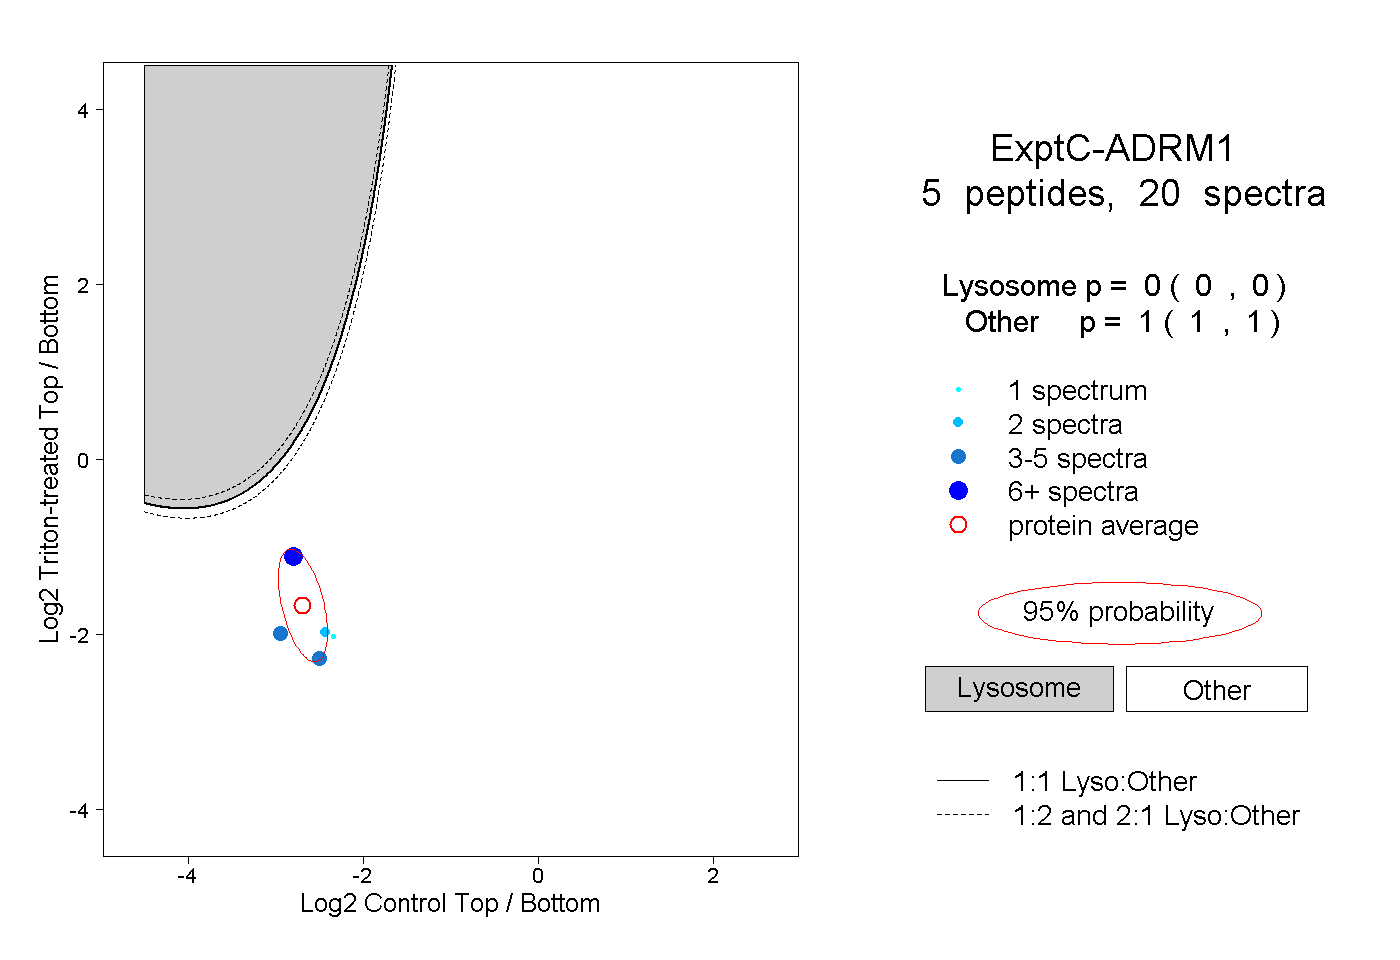 |
0.000 0.000 | 0.000 |
1.000 1.000 | 1.000 |