 7
7peptides
spectra
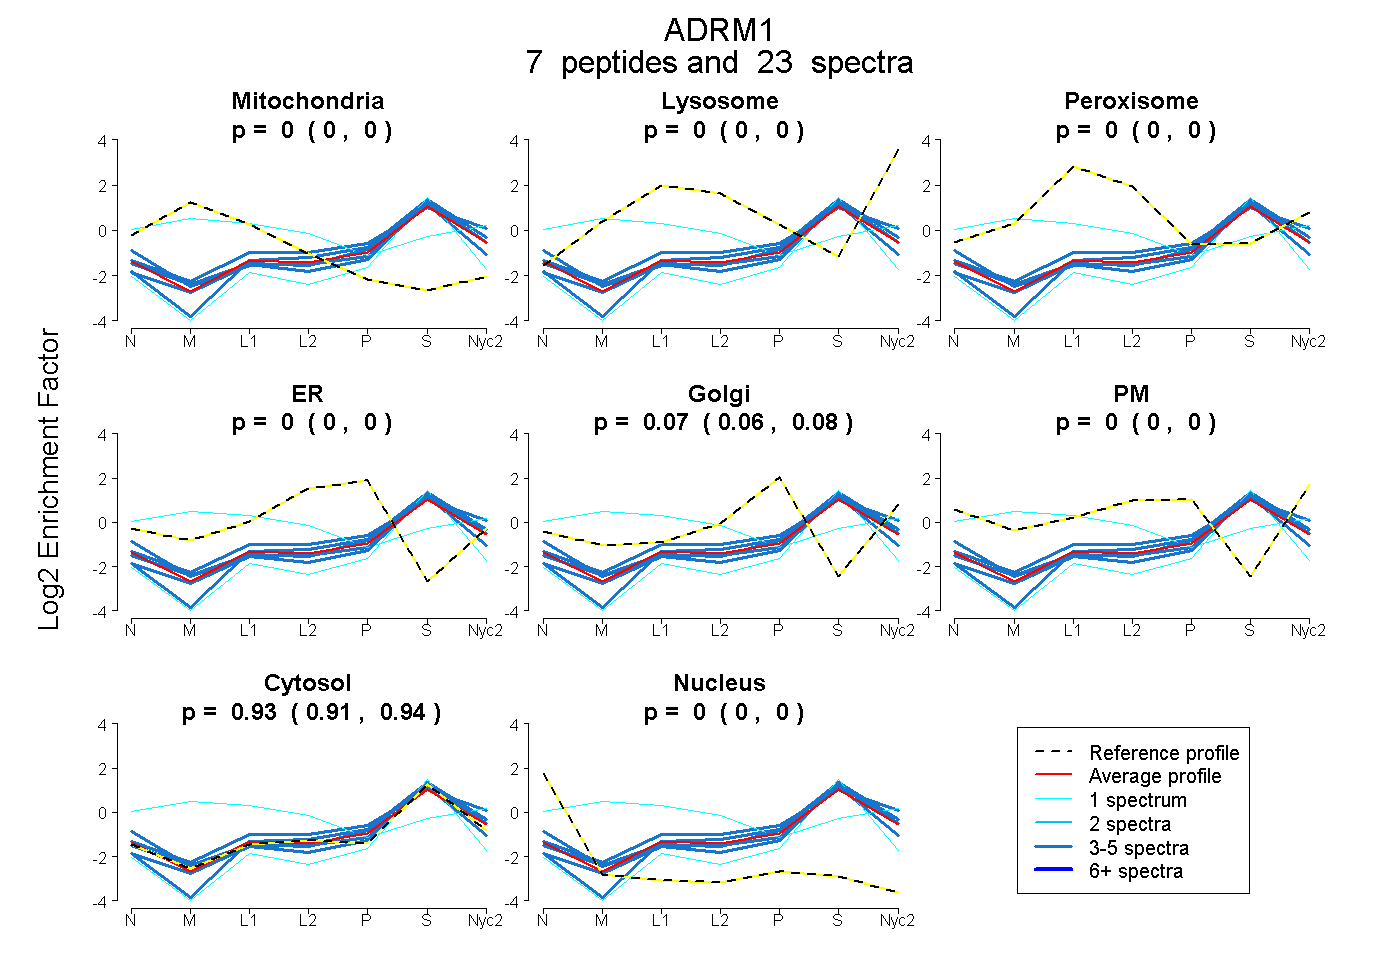
0.000 | 0.000
0.000 | 0.002
0.000 | 0.000
0.000 | 0.000
0.061 | 0.084
0.000 | 0.000
0.913 | 0.937
0.000 | 0.000
3peptides
spectra
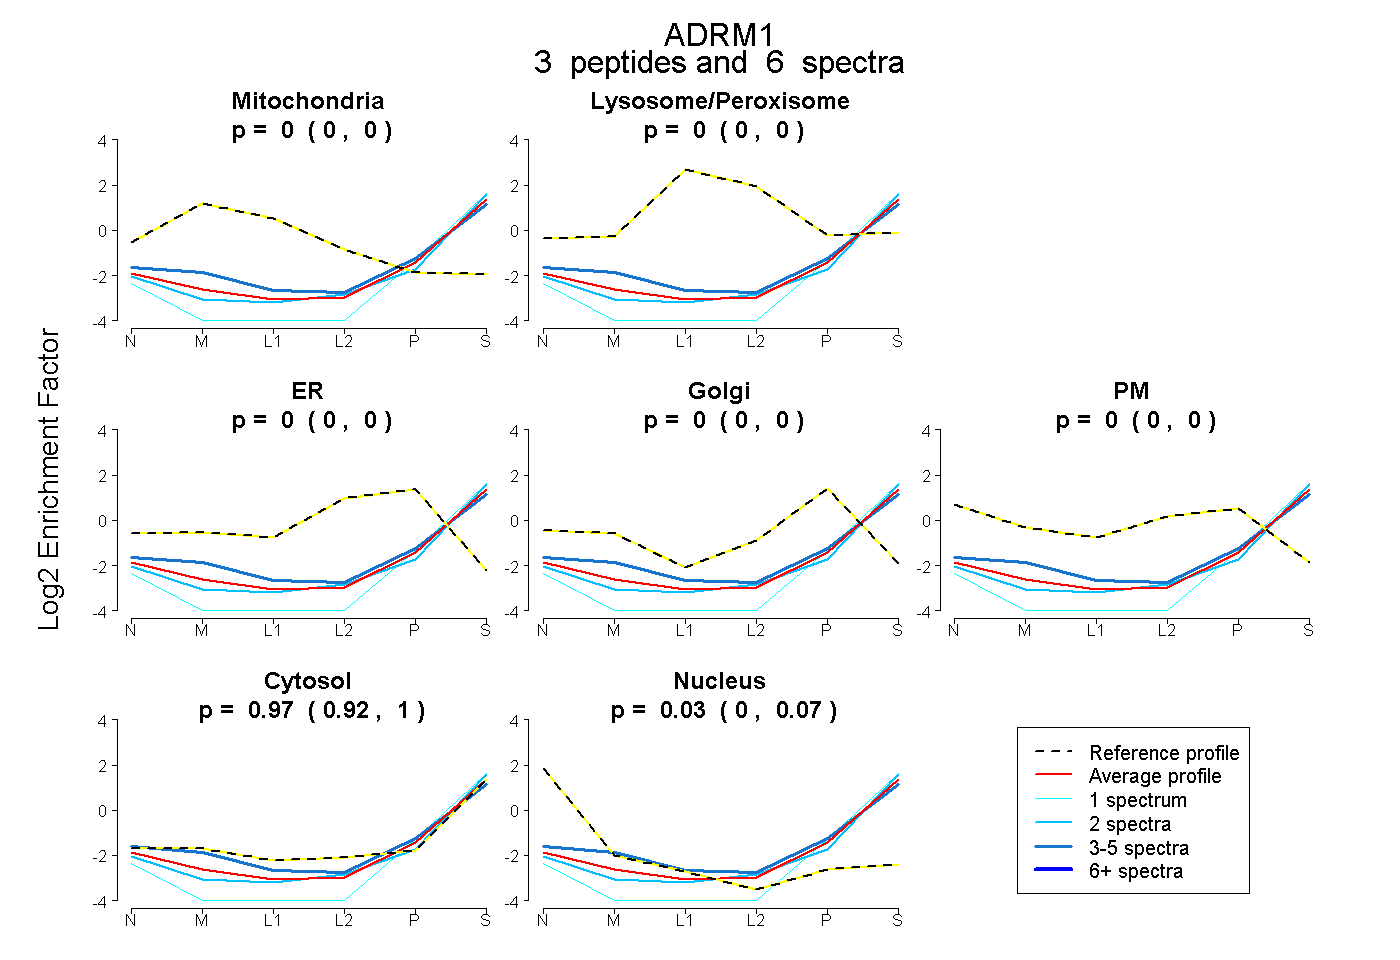
0.000 | 0.000
0.000 | 0.000
0.000 | 0.000
0.000 | 0.000
0.000 | 0.000
0.924 | 1.000
0.000 | 0.069
5peptides
spectra
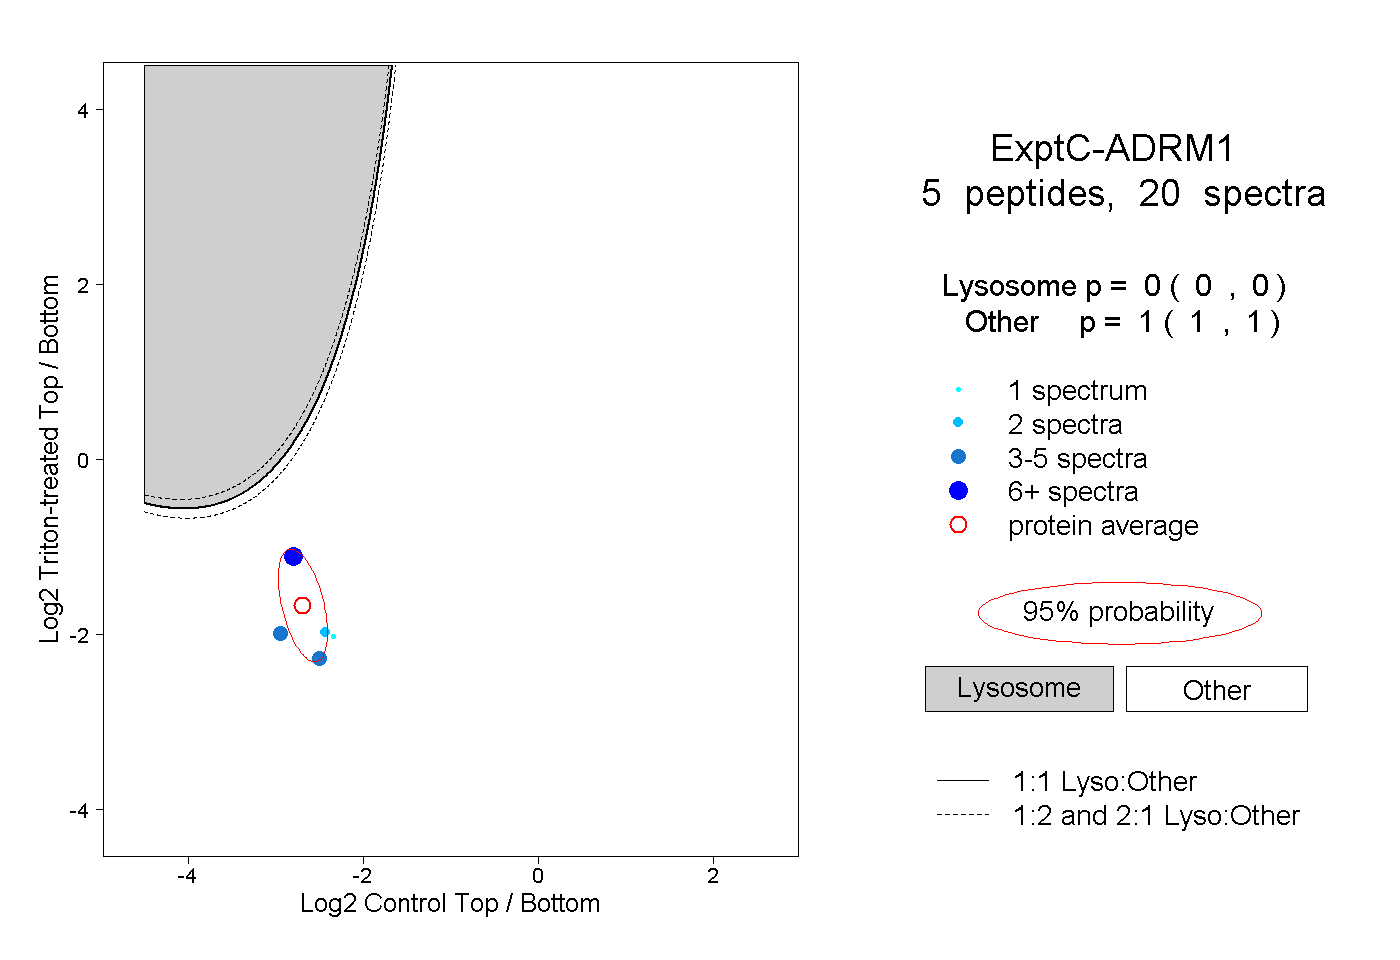
0.000 | 0.000
1.000 | 1.000