 5
5peptides
spectra
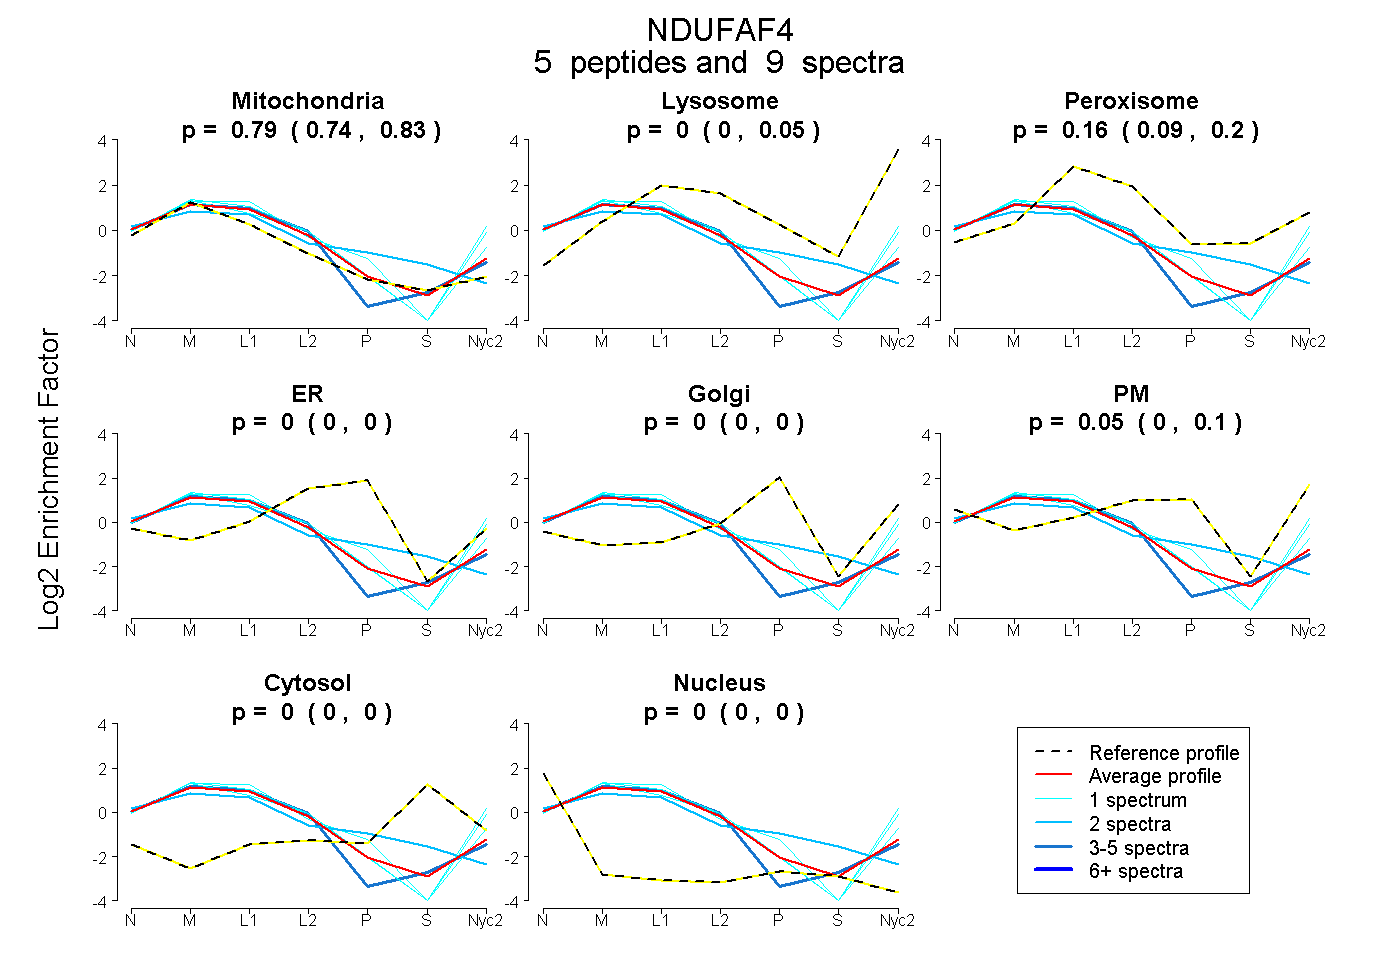
0.744 | 0.834
0.000 | 0.055
0.088 | 0.195
0.000 | 0.000
0.000 | 0.000
0.000 | 0.102
0.000 | 0.000
0.000 | 0.000
2peptides
spectra
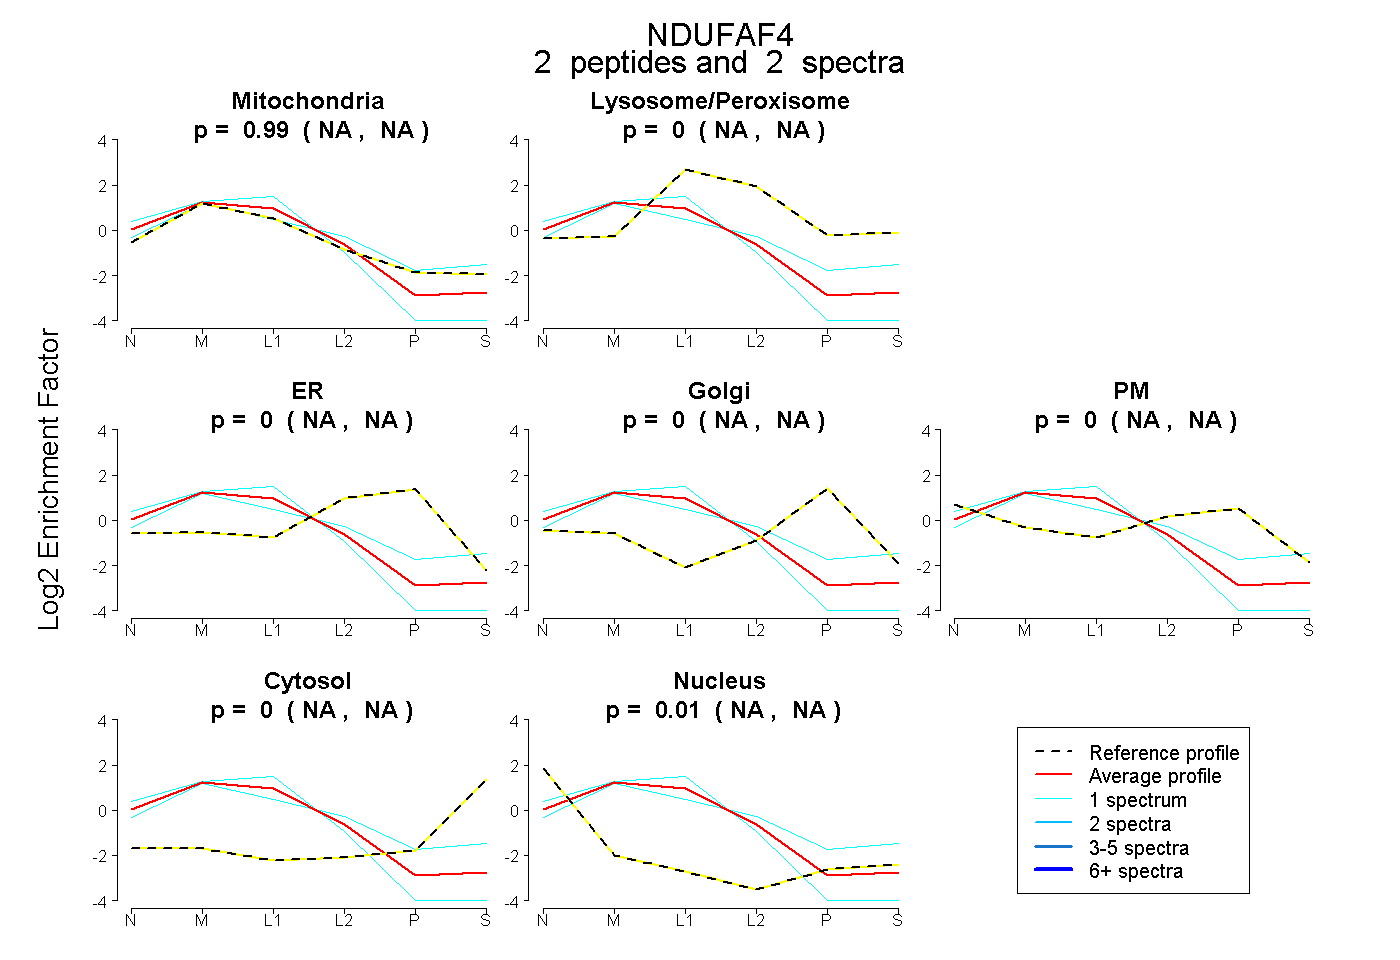
NA | NA
NA | NA
NA | NA
NA | NA
NA | NA
NA | NA
NA | NA
11peptides
spectra
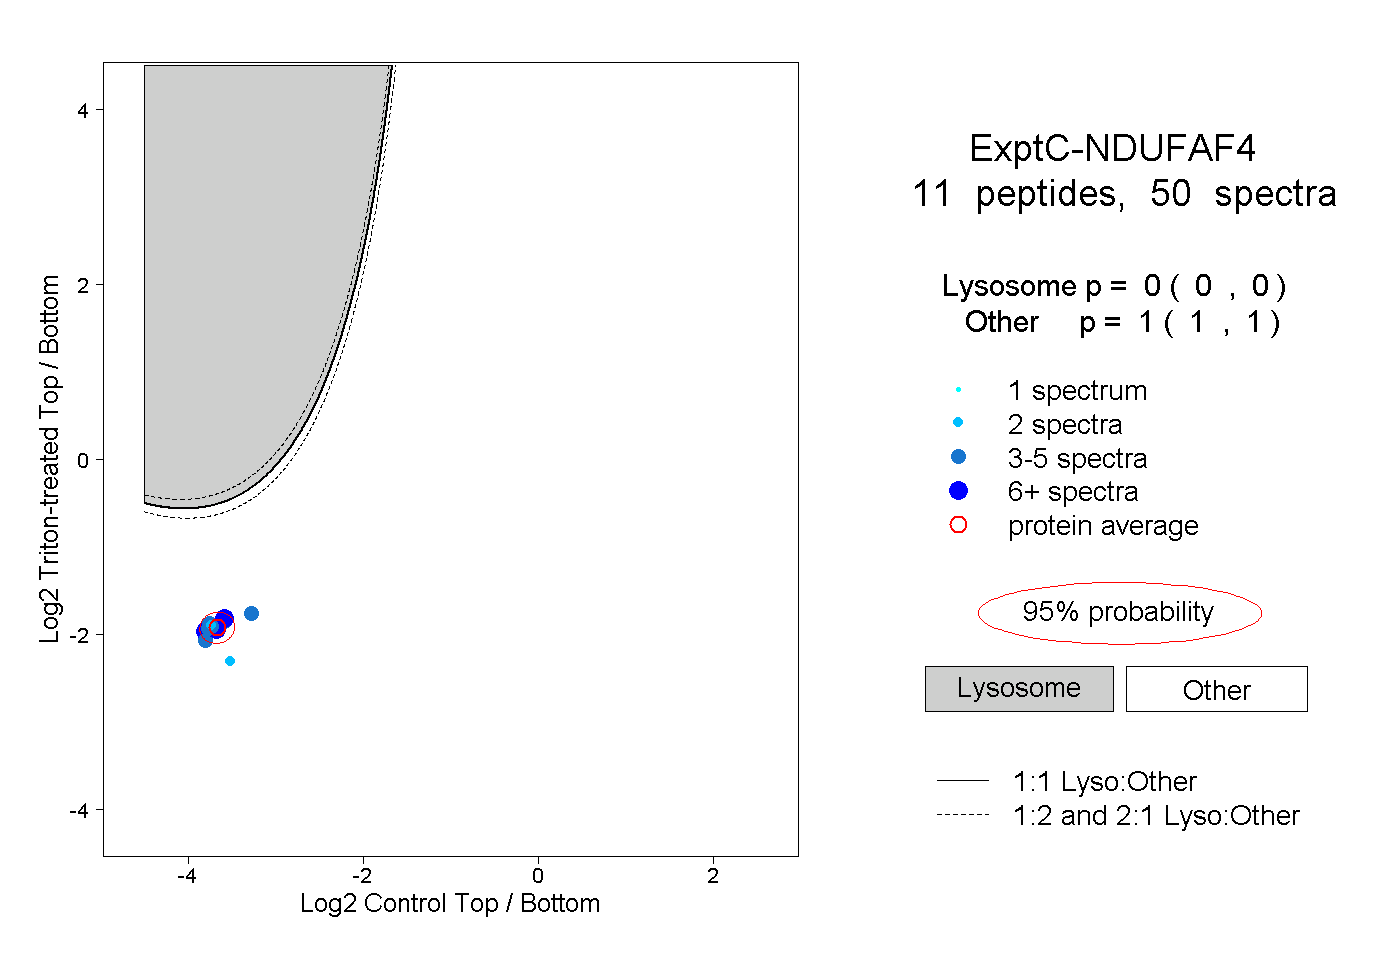
0.000 | 0.000
1.000 | 1.000
3peptides
spectra
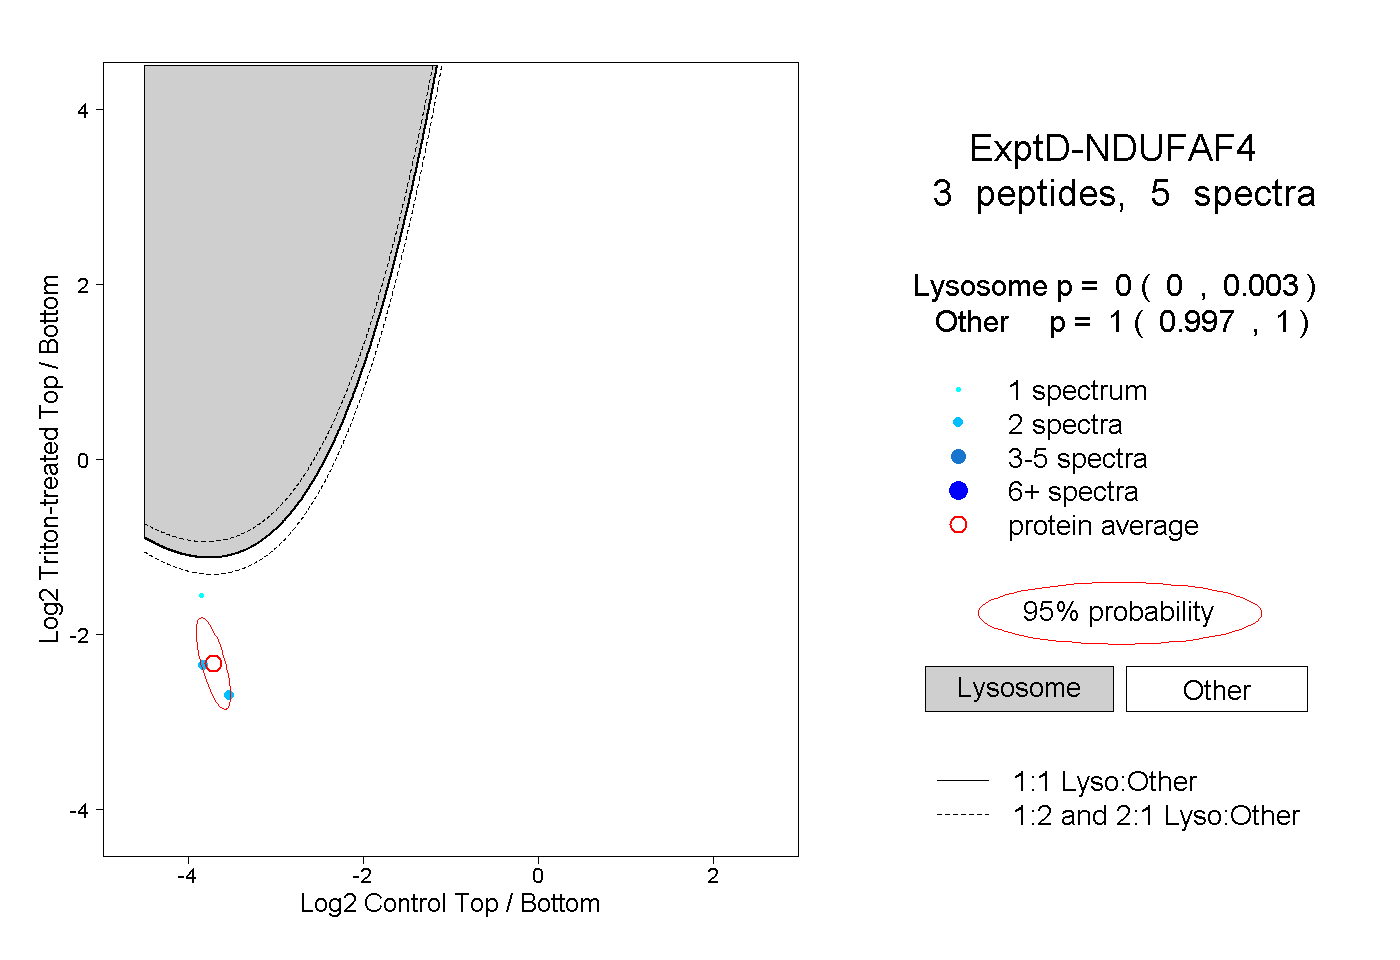
0.000 | 0.003
0.997 | 1.000