 6
6peptides
spectra
0.000 | 0.000
0.000 | 0.000
0.000 | 0.000
0.127 | 0.220
0.094 | 0.186
0.204 | 0.301
0.367 | 0.399
0.026 | 0.048
| Plot | Mito | Lyso | Perox | ER | Golgi | PM | Cytosol | Nucleus | |||||
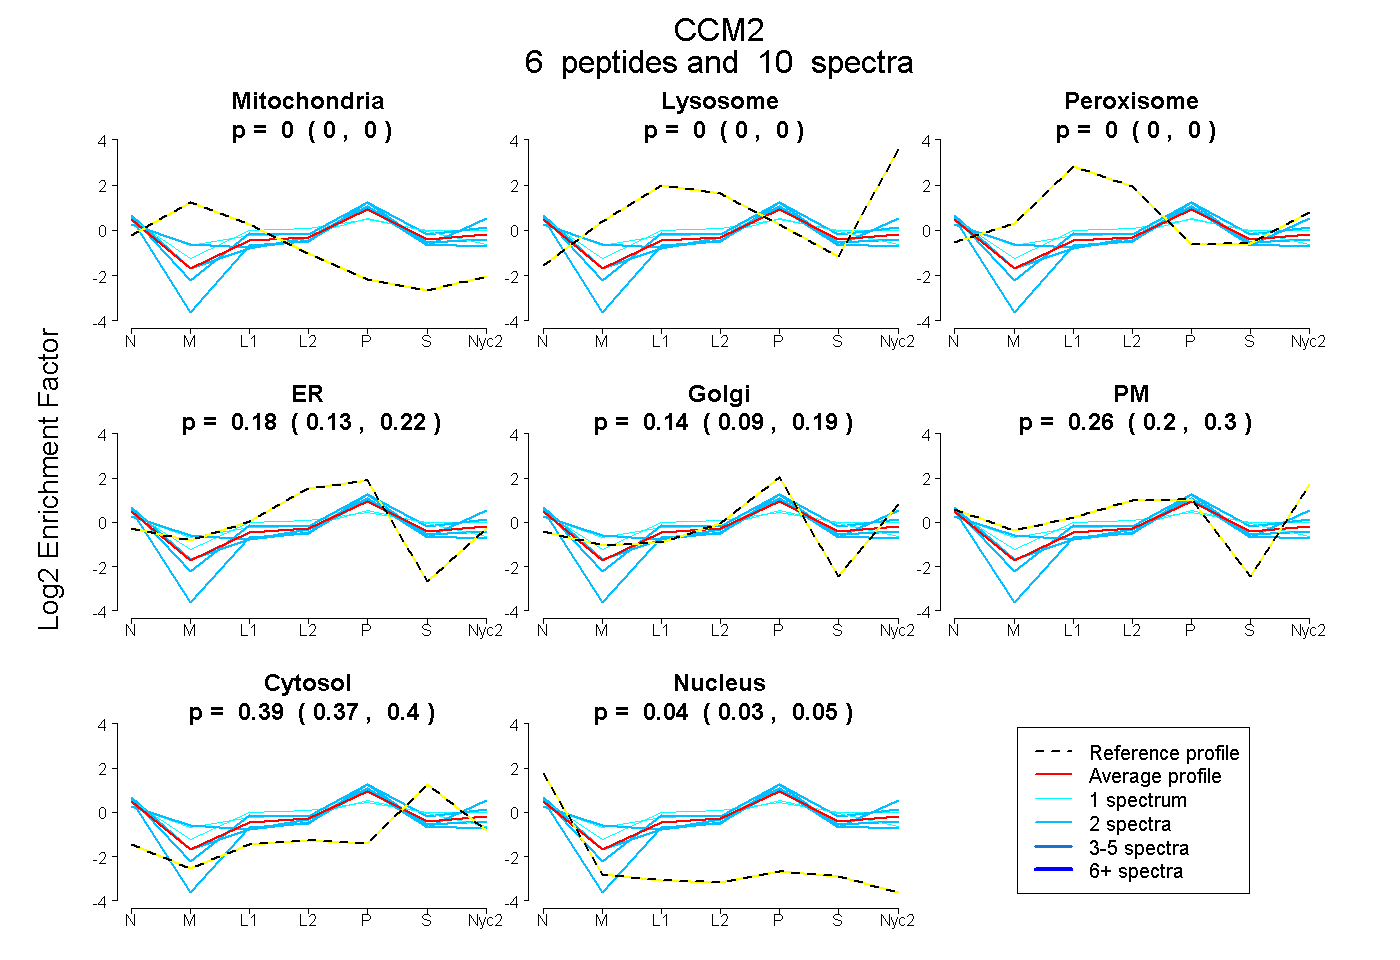
| Expt A |
6 peptides |
10 spectra |
|
0.000 0.000 | 0.000 |
0.000 0.000 | 0.000 |
0.000 0.000 | 0.000 |
0.178 0.127 | 0.220 |
0.143 0.094 | 0.186 |
0.256 0.204 | 0.301 |
0.385 0.367 | 0.399 |
0.038 0.026 | 0.048 |
| 1 spectrum, LSSQEIQQFAALLHEYR | 0.000 | 0.000 | 0.123 | 0.097 | 0.000 | 0.361 | 0.406 | 0.013 | ||
| 2 spectra, VPIHDIAAVSYVR | 0.012 | 0.000 | 0.000 | 0.000 | 0.315 | 0.368 | 0.304 | 0.000 | ||
| 2 spectra, SAPSEGDEWDR | 0.000 | 0.000 | 0.000 | 0.006 | 0.514 | 0.011 | 0.453 | 0.016 | ||
| 2 spectra, TEILHFIDK | 0.000 | 0.000 | 0.000 | 0.468 | 0.073 | 0.049 | 0.339 | 0.070 | ||
| 2 spectra, DGEDIILR | 0.000 | 0.000 | 0.000 | 0.202 | 0.229 | 0.160 | 0.329 | 0.080 | ||
| 1 spectrum, TAQDPGISPSQSLCAEGSR | 0.018 | 0.000 | 0.204 | 0.193 | 0.145 | 0.037 | 0.342 | 0.061 |
| Plot | Mito | Lyso or Perox | ER | Golgi | PM | Cytosol | Nucleus | ||||||
| Expt B |
2 peptides |
2 spectra |
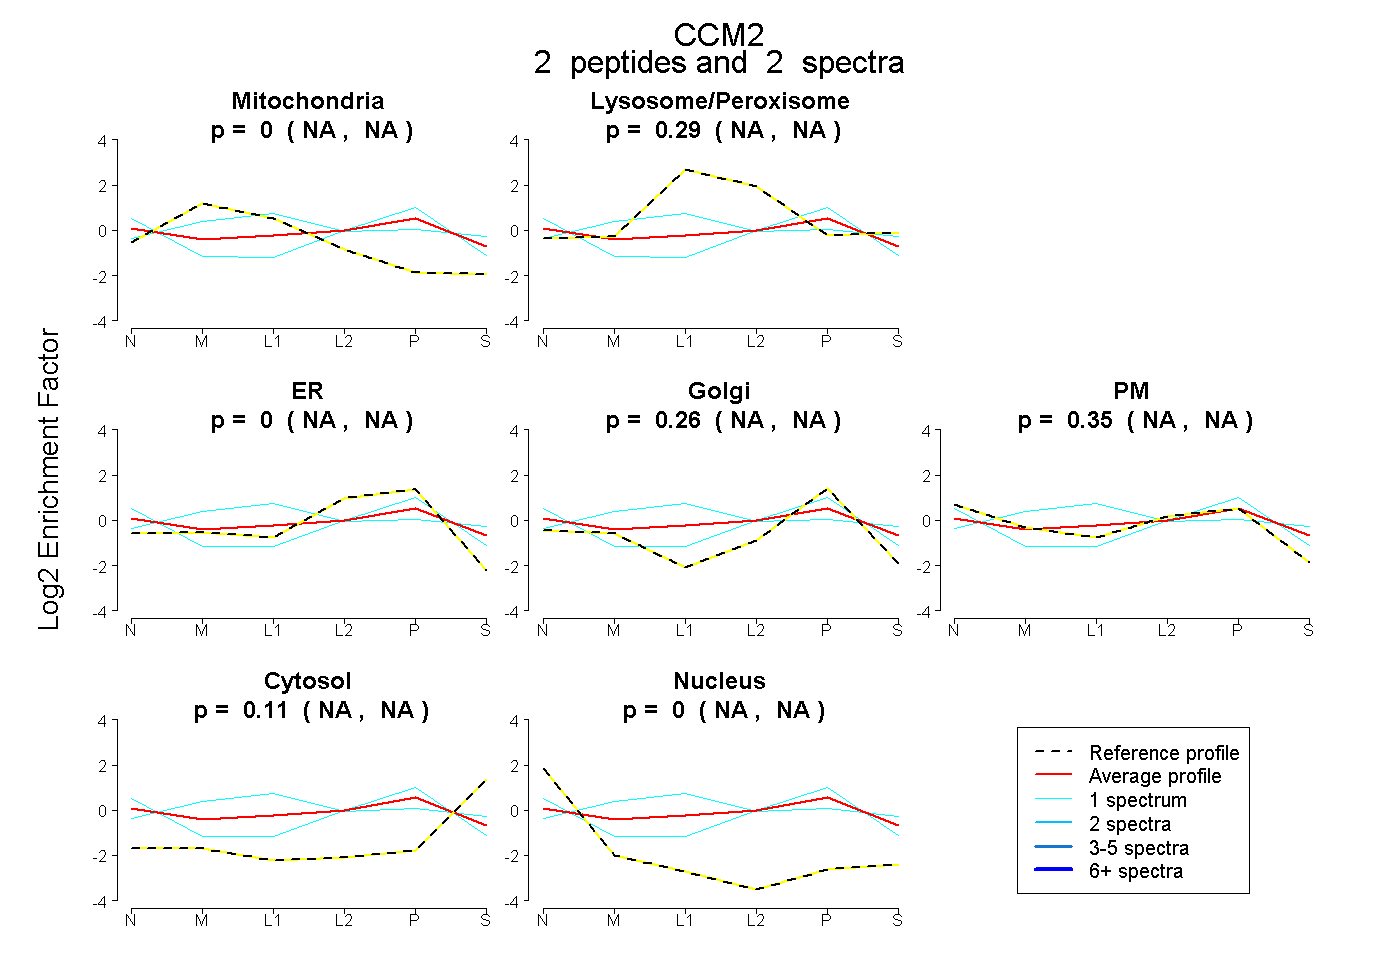 |
0.000 NA | NA |
0.287 NA | NA |
0.000 NA | NA |
0.256 NA | NA |
0.346 NA | NA |
0.111 NA | NA |
0.000 NA | NA |
|||
| Plot | Lyso | Other | |||||||||||
| Expt C |
3 peptides |
6 spectra |
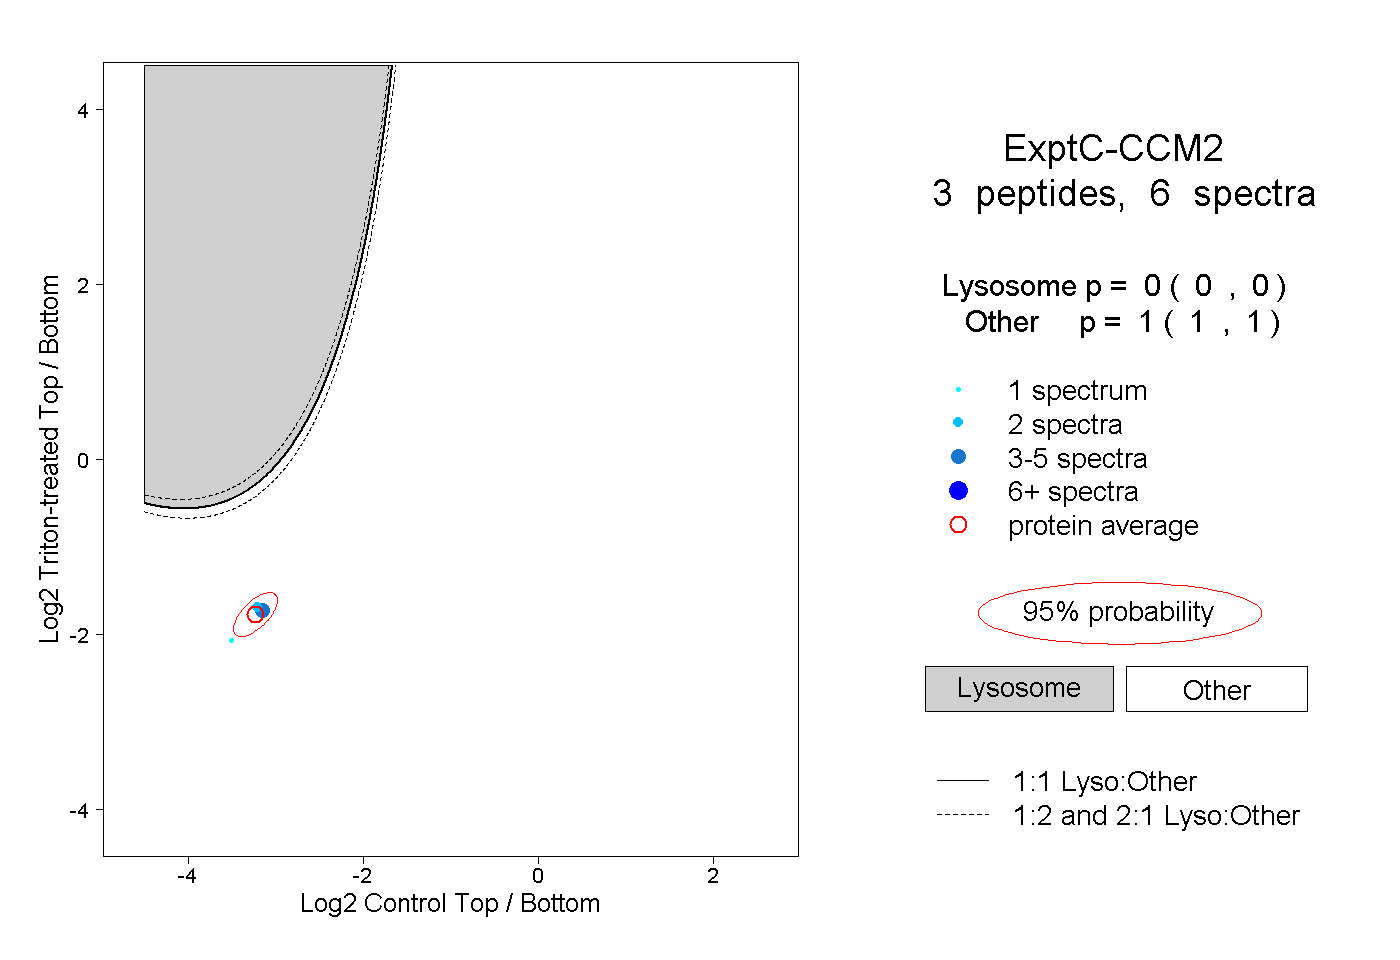 |
0.000 0.000 | 0.000 |
1.000 1.000 | 1.000 |
||||||||
| Plot | Lyso | Other | |||||||||||
| Expt D |
1 peptide |
1 spectrum |
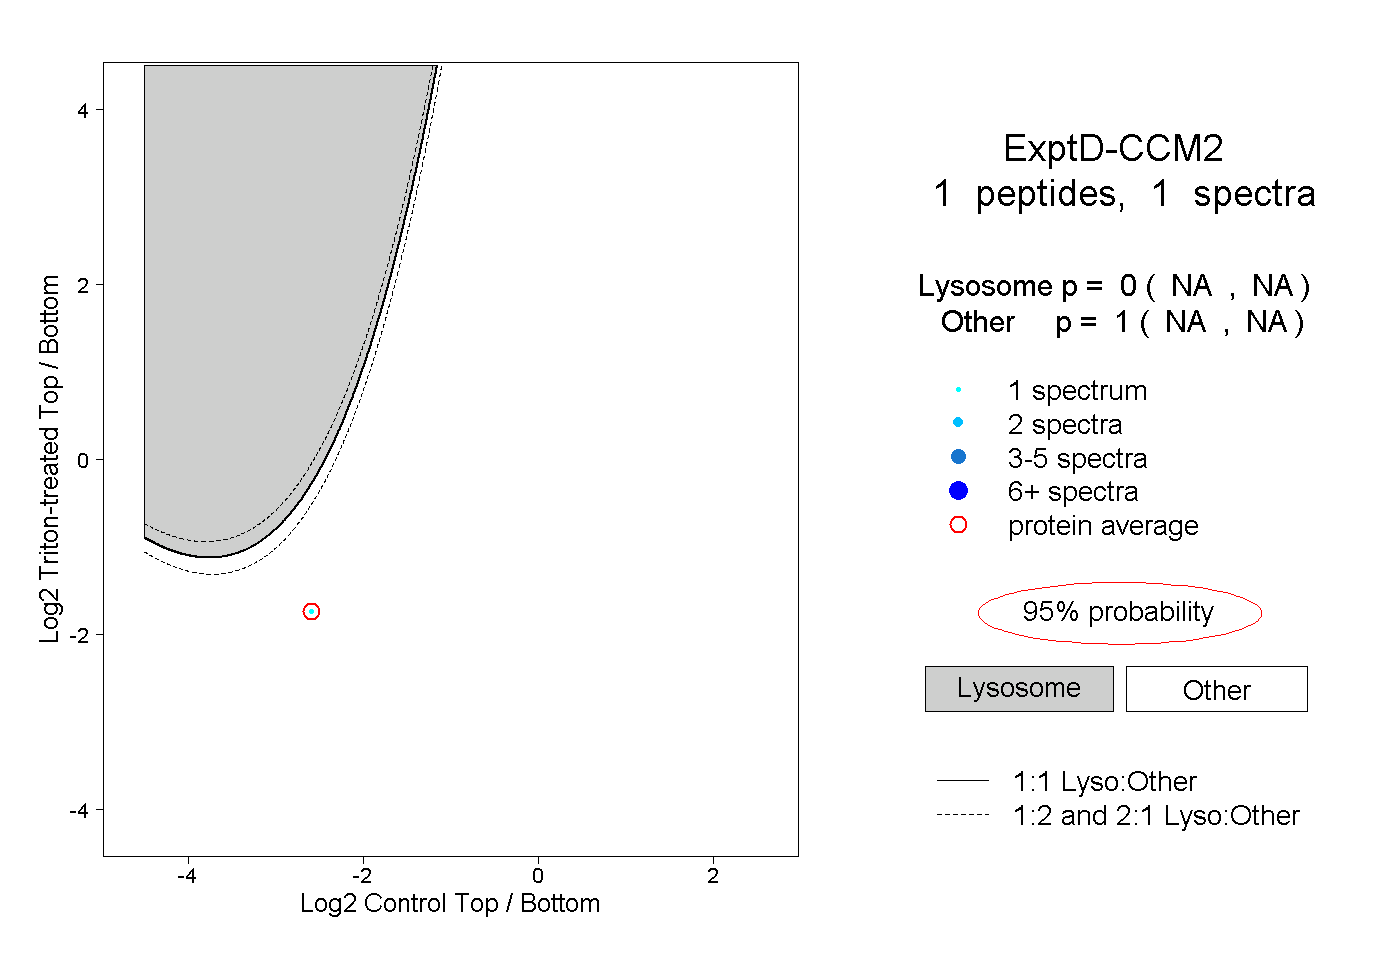 |
0.000 NA | NA |
1.000 NA | NA |