7
7peptides
spectra
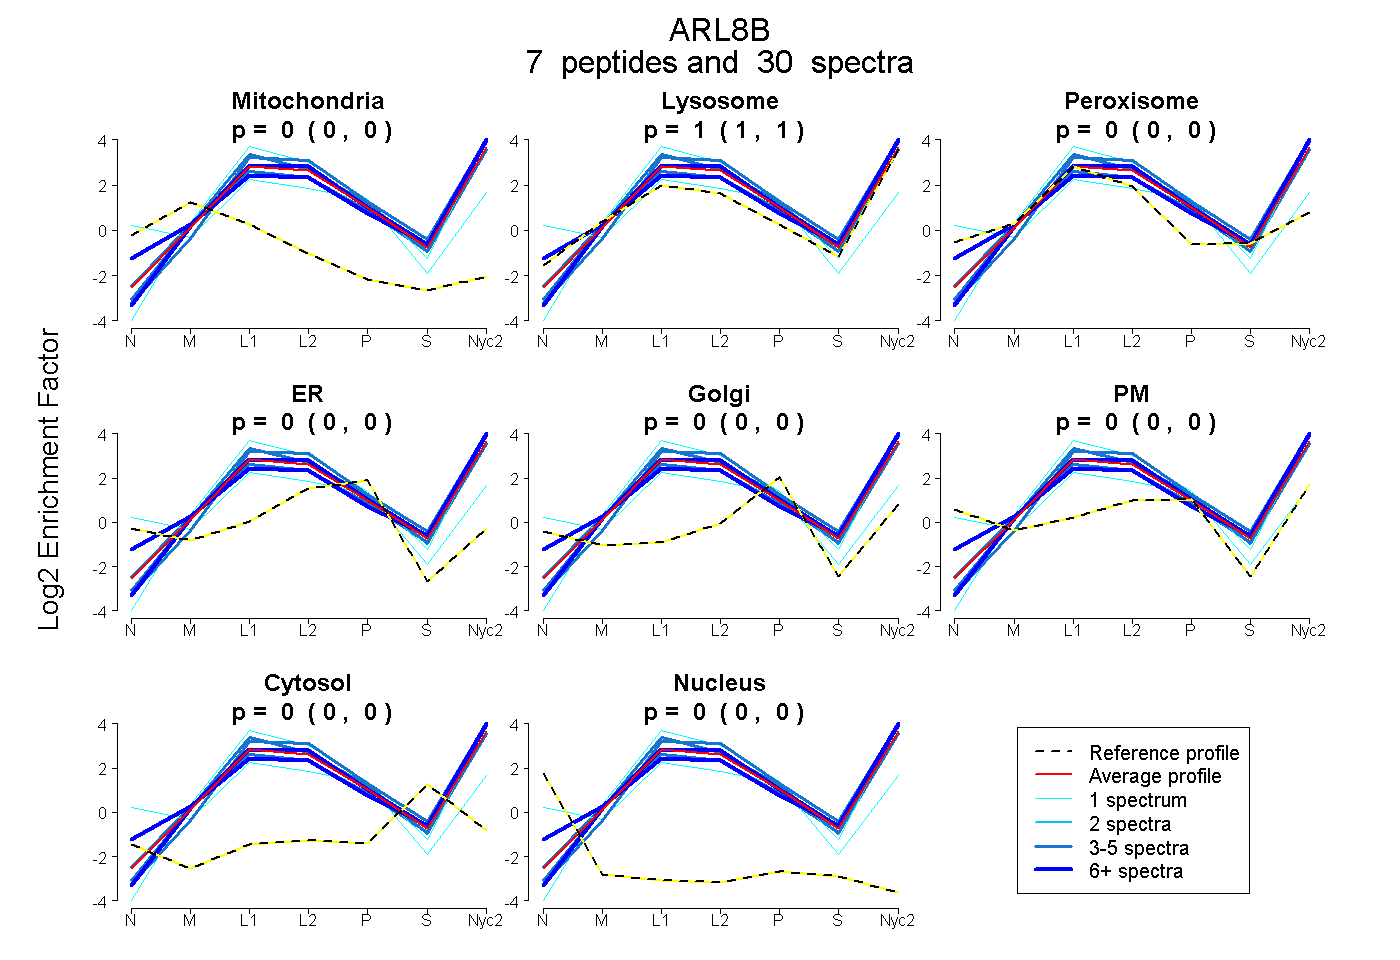
0.000 | 0.000
1.000 | 1.000
0.000 | 0.000
0.000 | 0.000
0.000 | 0.000
0.000 | 0.000
0.000 | 0.000
0.000 | 0.000
7peptides
spectra
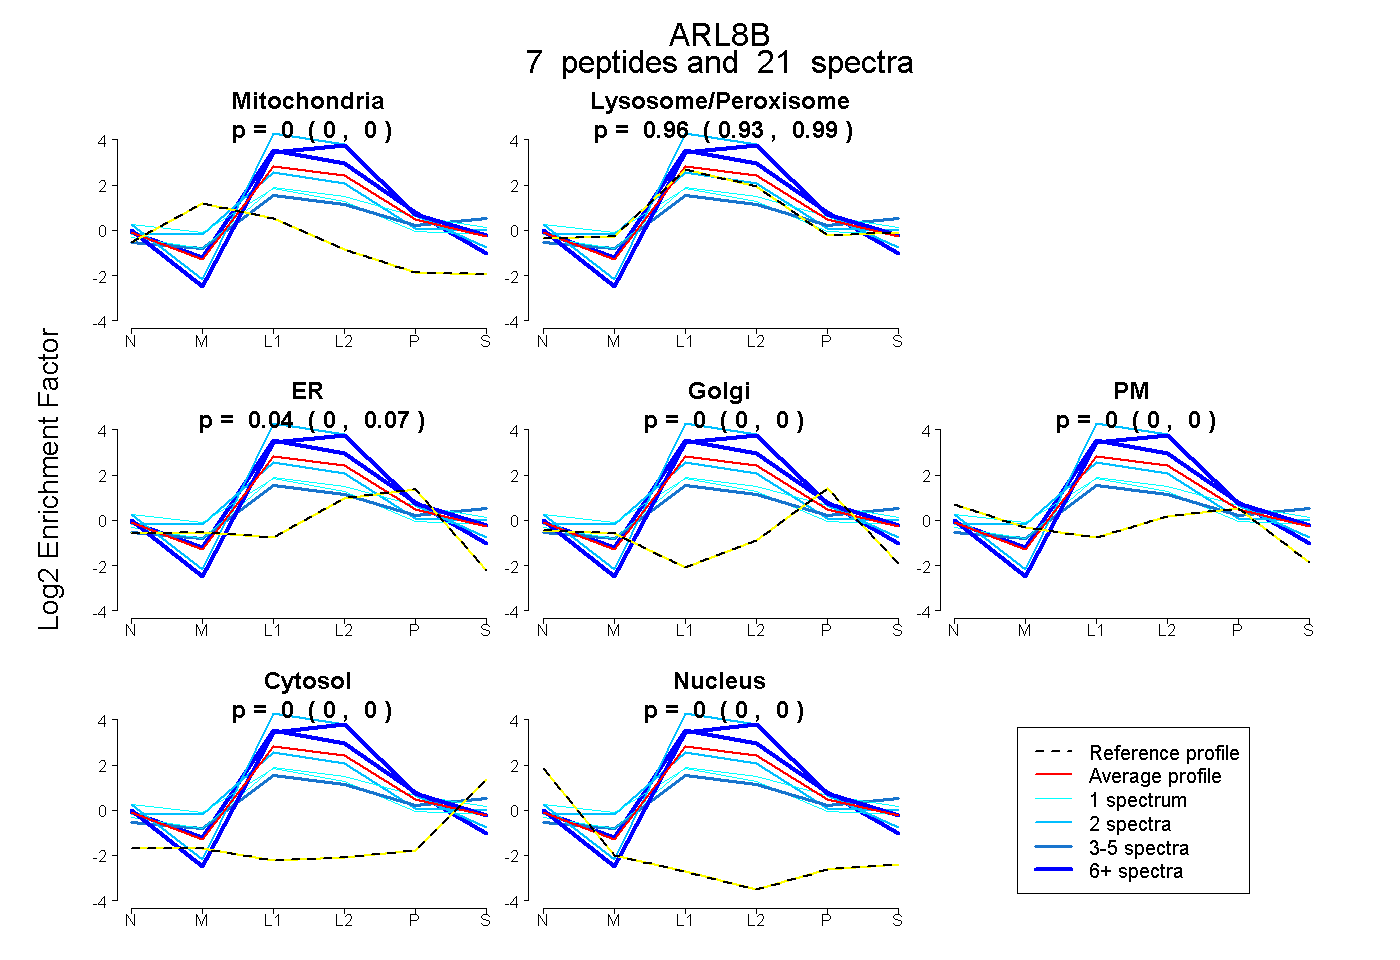
0.000 | 0.000
0.930 | 0.991
0.002 | 0.066
0.000 | 0.000
0.000 | 0.000
0.000 | 0.000
0.000 | 0.000