 3
3peptides
spectra
0.000 | 0.140
0.000 | 0.131
0.000 | 0.117
0.000 | 0.000
0.000 | 0.019
0.000 | 0.064
0.698 | 0.956
0.000 | 0.042
2peptides
spectra
NA | NA
NA | NA
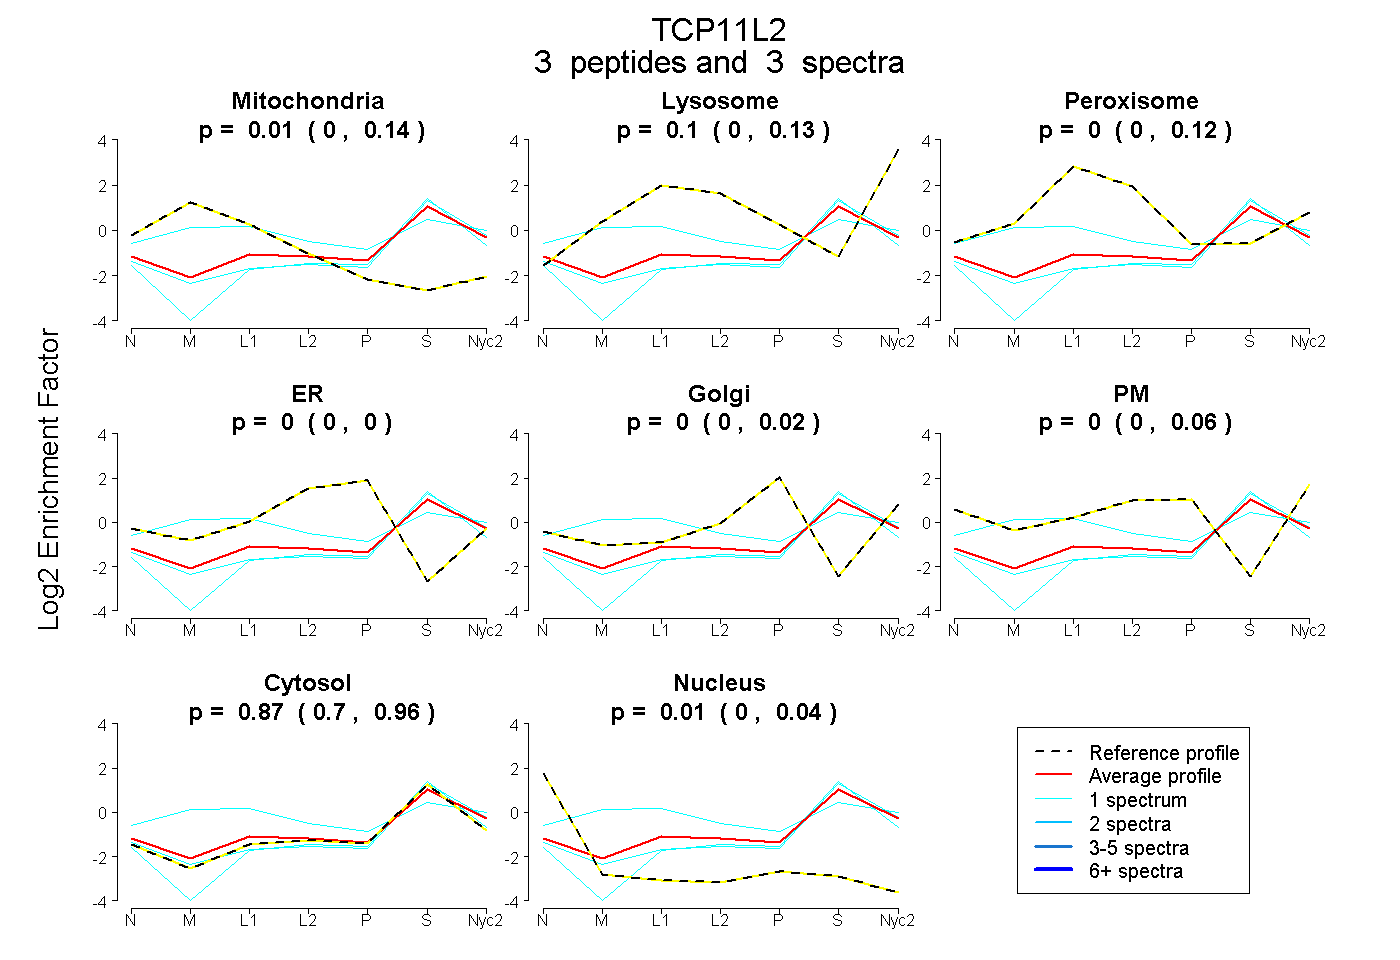
| Plot | Mito | Lyso | Perox | ER | Golgi | PM | Cytosol | Nucleus | |||||
| Expt A |
3 peptides |
3 spectra |
|
0.014 0.000 | 0.140 |
0.102 0.000 | 0.131 |
0.000 0.000 | 0.117 |
0.000 0.000 | 0.000 |
0.000 0.000 | 0.019 |
0.000 0.000 | 0.064 |
0.871 0.698 | 0.956 |
0.014 0.000 | 0.042 |
||
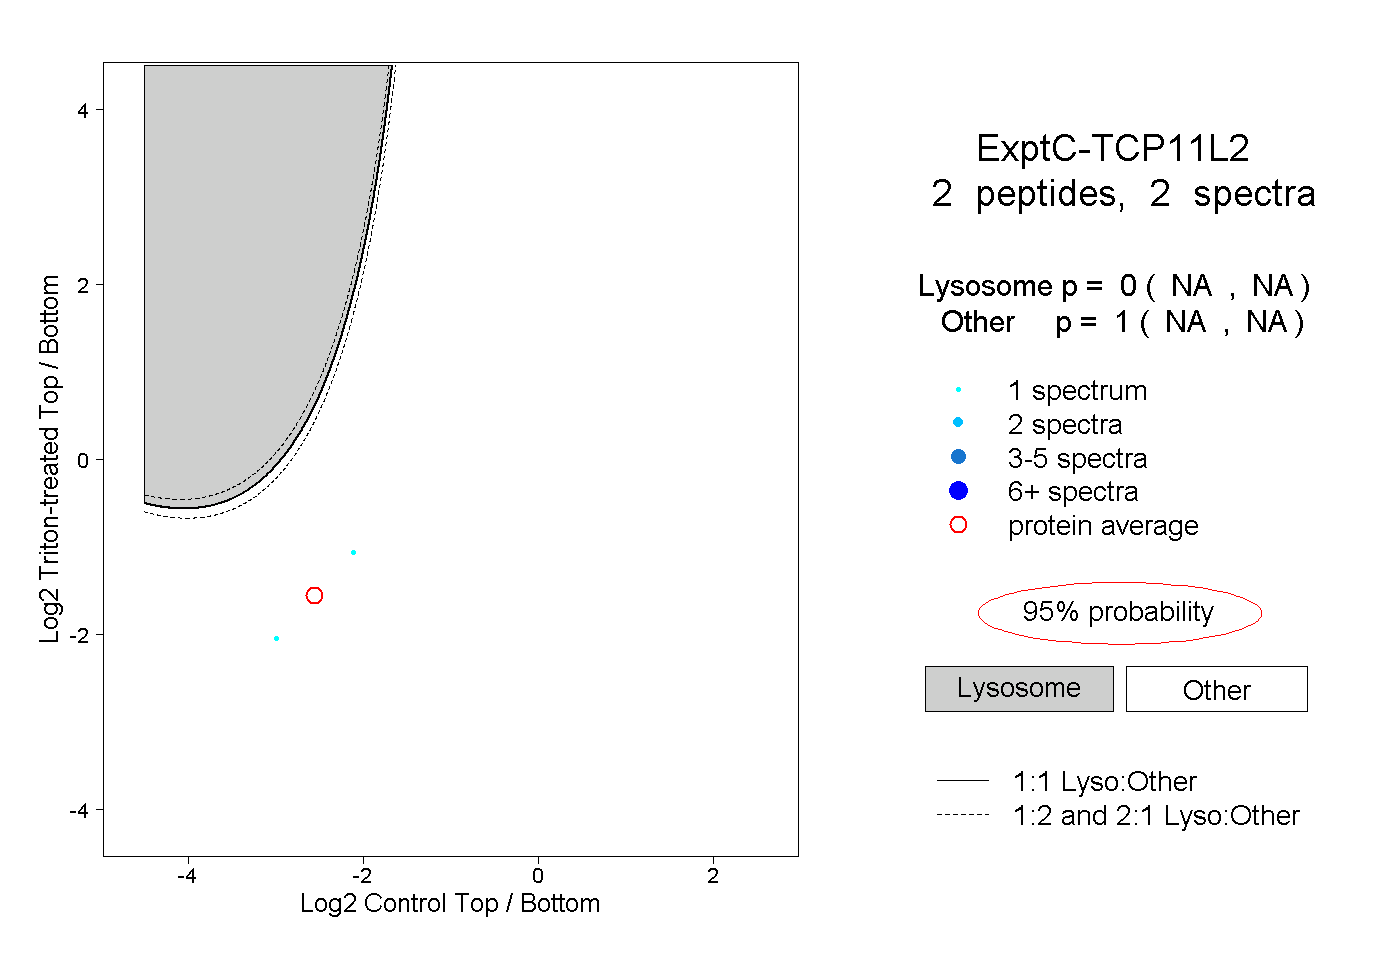
| Plot | Lyso | Other | |||||||||||
| Expt C |
2 peptides |
2 spectra |
|
0.000 NA | NA |
1.000 NA | NA |