 7
7peptides
spectra
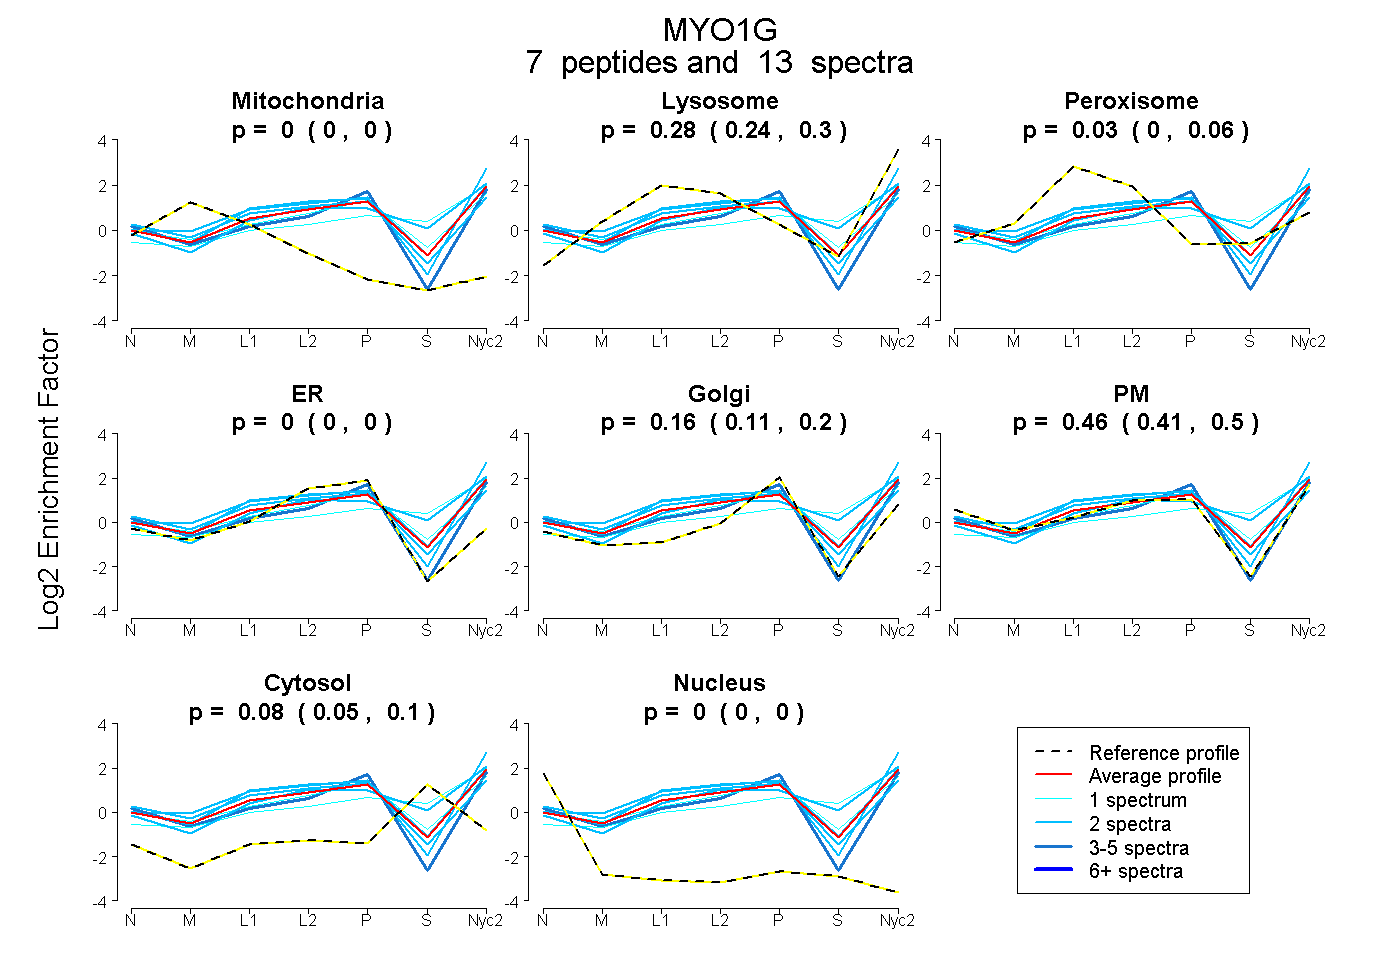
0.000 | 0.000
0.245 | 0.301
0.000 | 0.057
0.000 | 0.000
0.111 | 0.199
0.409 | 0.500
0.054 | 0.101
0.000 | 0.000
| Plot | Mito | Lyso | Perox | ER | Golgi | PM | Cytosol | Nucleus | |||||
| Expt A |
7 peptides |
13 spectra |
|
0.000 0.000 | 0.000 |
0.276 0.245 | 0.301 |
0.029 0.000 | 0.057 |
0.000 0.000 | 0.000 |
0.159 0.111 | 0.199 |
0.457 0.409 | 0.500 |
0.079 0.054 | 0.101 |
0.000 0.000 | 0.000 |
| 2 spectra, RPLTAGTLFK | 0.000 | 0.379 | 0.000 | 0.000 | 0.000 | 0.367 | 0.254 | 0.000 | ||
| 2 spectra, ALLLTDR | 0.000 | 0.354 | 0.000 | 0.000 | 0.002 | 0.644 | 0.000 | 0.000 | ||
| 2 spectra, VSDCIPLSQR | 0.000 | 0.053 | 0.239 | 0.000 | 0.219 | 0.489 | 0.000 | 0.000 | ||
| 2 spectra, LISVEPRPEQTEPDFQCSR | 0.000 | 0.251 | 0.157 | 0.000 | 0.193 | 0.392 | 0.006 | 0.000 | ||
| 3 spectra, GSEDQELQELHLER | 0.000 | 0.064 | 0.000 | 0.000 | 0.323 | 0.614 | 0.000 | 0.000 | ||
| 1 spectrum, LTATPSDLVLR | 0.000 | 0.423 | 0.000 | 0.000 | 0.100 | 0.127 | 0.350 | 0.000 | ||
| 1 spectrum, LDEAHCR | 0.000 | 0.220 | 0.067 | 0.000 | 0.238 | 0.351 | 0.124 | 0.000 |
| Plot | Lyso | Other | |||||||||||
| Expt C |
2 peptides |
7 spectra |
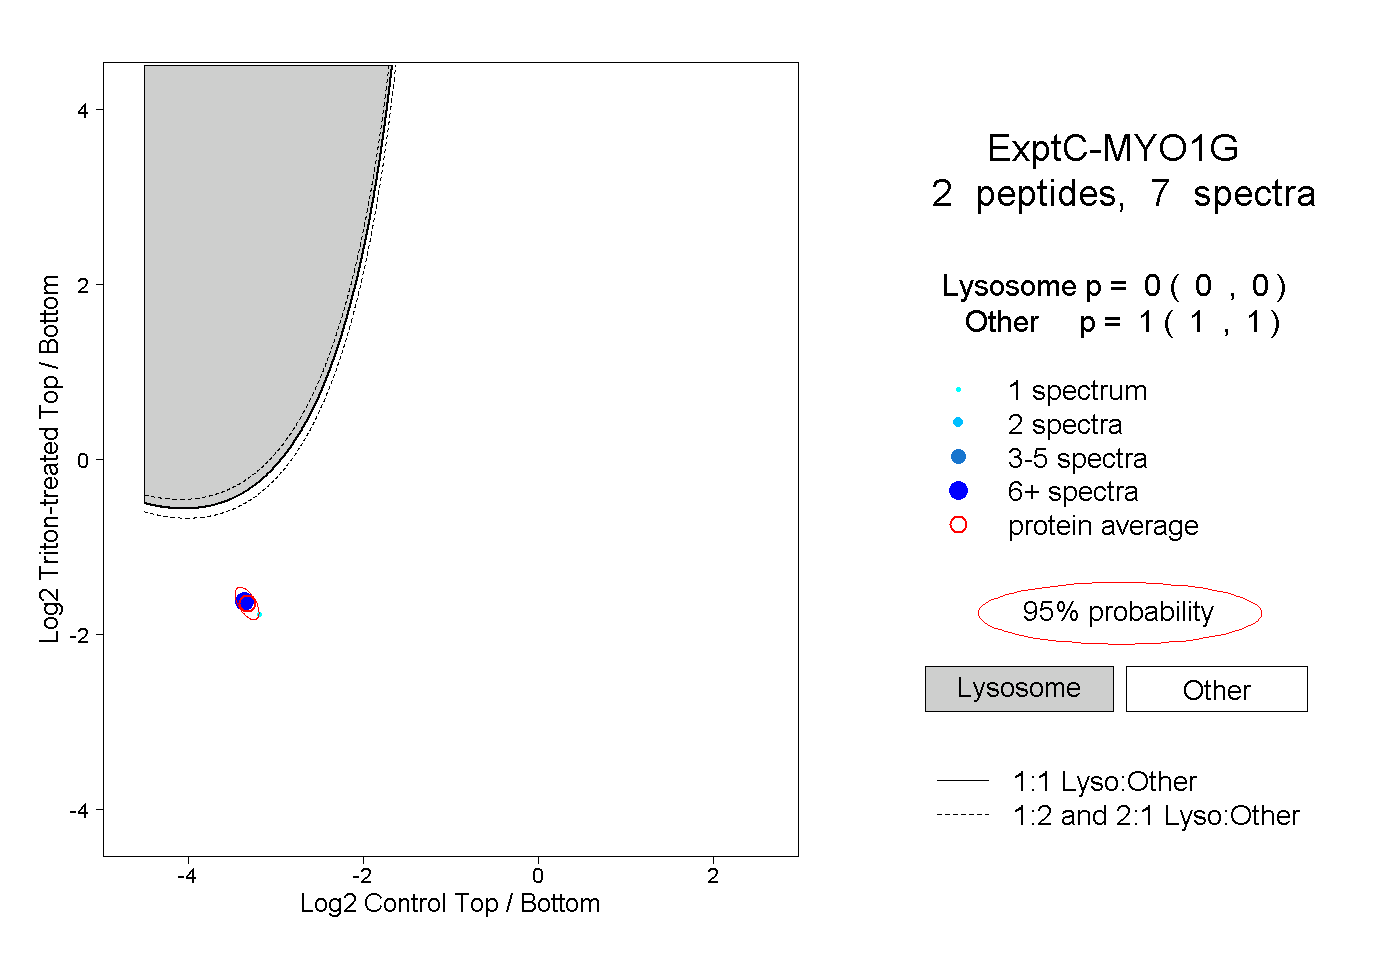 |
0.000 0.000 | 0.000 |
1.000 1.000 | 1.000 |