 4
4peptides
spectra
0.017 | 0.312
0.000 | 0.104
0.000 | 0.183
0.000 | 0.273
0.000 | 0.615
0.000 | 0.274
0.125 | 0.276
0.000 | 0.181
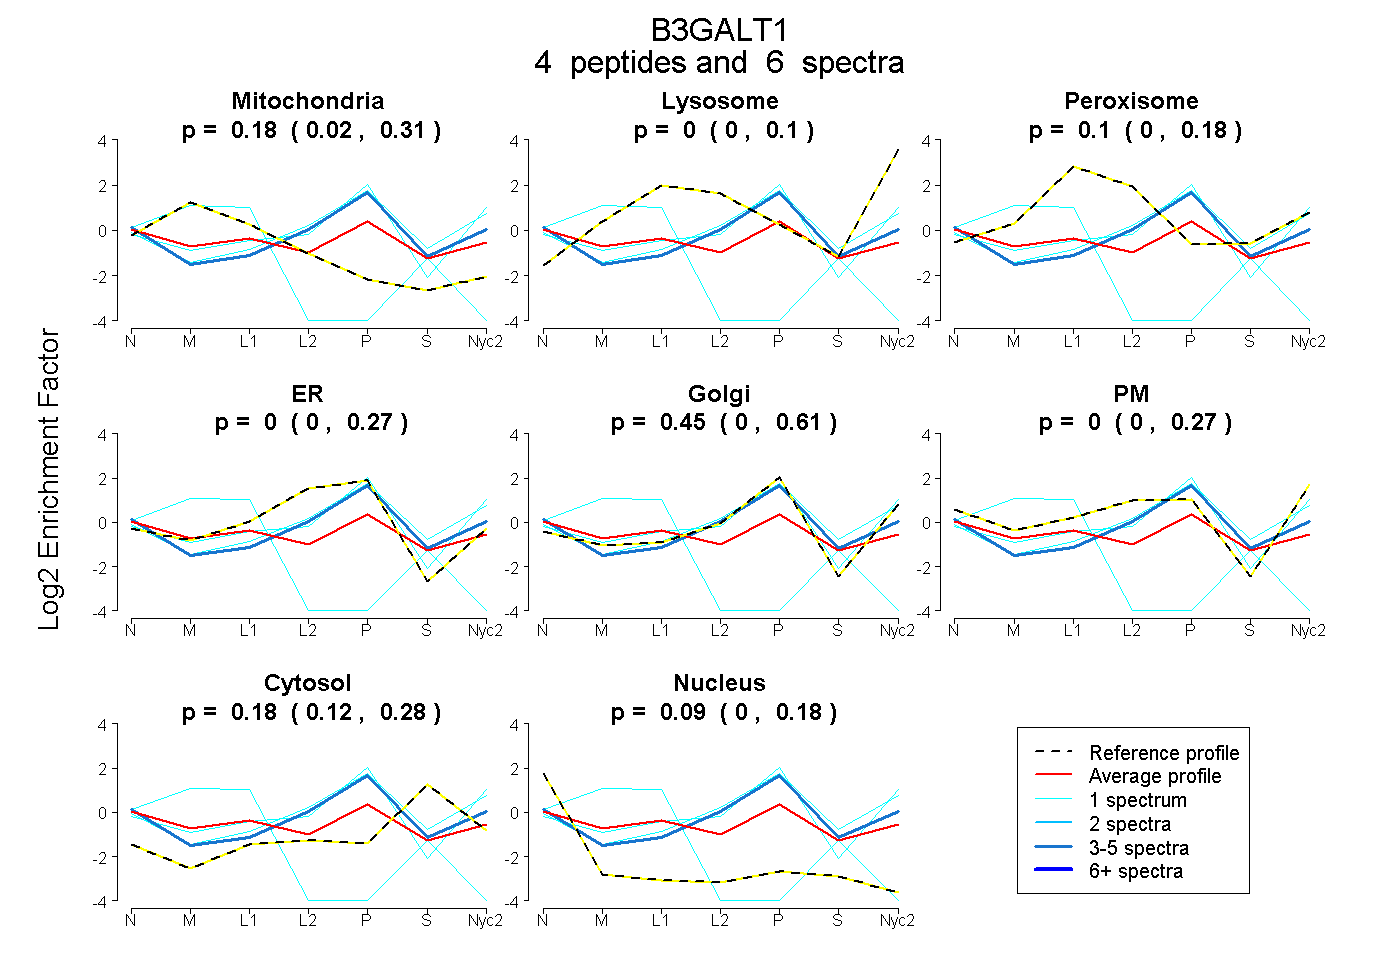
| Plot | Mito | Lyso | Perox | ER | Golgi | PM | Cytosol | Nucleus | |||||
| Expt A |
4 peptides |
6 spectra |
|
0.180 0.017 | 0.312 |
0.000 0.000 | 0.104 |
0.097 0.000 | 0.183 |
0.000 0.000 | 0.273 |
0.452 0.000 | 0.615 |
0.000 0.000 | 0.274 |
0.183 0.125 | 0.276 |
0.087 0.000 | 0.181 |
| 1 spectrum, ETWGDENNFK | 0.000 | 0.033 | 0.036 | 0.000 | 0.877 | 0.048 | 0.007 | 0.000 | ||
| 1 spectrum, TLMGMR | 0.000 | 0.003 | 0.000 | 0.016 | 0.587 | 0.172 | 0.222 | 0.000 | ||
| 3 spectra, WVATFCSK | 0.000 | 0.000 | 0.000 | 0.166 | 0.602 | 0.000 | 0.215 | 0.017 | ||
| 1 spectrum, SMNNPMSSK | 0.774 | 0.000 | 0.000 | 0.000 | 0.000 | 0.000 | 0.000 | 0.226 |
| Plot | Lyso | Other | |||||||||||
| Expt C |
2 peptides |
3 spectra |
 |
0.000 0.000 | 0.000 |
1.000 1.000 | 1.000 |