 9
9peptides
spectra
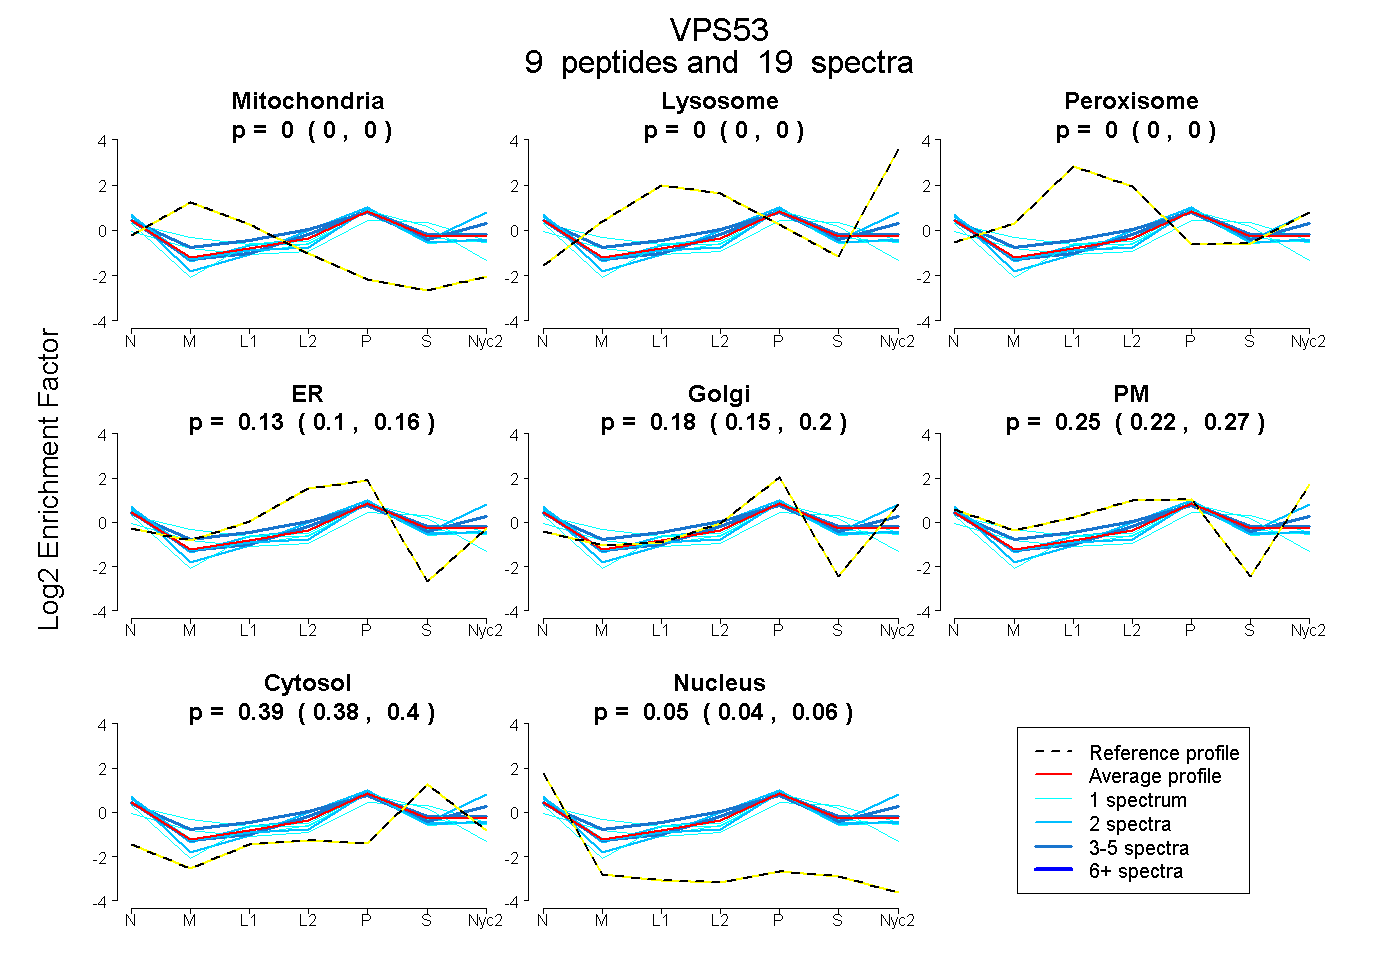
0.000 | 0.000
0.000 | 0.000
0.000 | 0.000
0.096 | 0.159
0.152 | 0.203
0.224 | 0.271
0.381 | 0.398
0.041 | 0.055
| Plot | Mito | Lyso | Perox | ER | Golgi | PM | Cytosol | Nucleus | |||||
| Expt A |
9 peptides |
19 spectra |
|
0.000 0.000 | 0.000 |
0.000 0.000 | 0.000 |
0.000 0.000 | 0.000 |
0.130 0.096 | 0.159 |
0.181 0.152 | 0.203 |
0.250 0.224 | 0.271 |
0.391 0.381 | 0.398 |
0.048 0.041 | 0.055 |
| 1 spectrum, DACLVANILDPR | 0.083 | 0.000 | 0.000 | 0.000 | 0.295 | 0.104 | 0.518 | 0.000 | ||
| 5 spectra, RPGGPSNVLR | 0.000 | 0.000 | 0.000 | 0.094 | 0.013 | 0.523 | 0.370 | 0.000 | ||
| 4 spectra, QLVDYEEK | 0.000 | 0.000 | 0.000 | 0.129 | 0.195 | 0.238 | 0.409 | 0.028 | ||
| 1 spectrum, LLTDCNTETFQK | 0.179 | 0.000 | 0.032 | 0.000 | 0.425 | 0.097 | 0.267 | 0.000 | ||
| 2 spectra, FVADFK | 0.000 | 0.000 | 0.000 | 0.000 | 0.182 | 0.462 | 0.356 | 0.000 | ||
| 1 spectrum, APDNPFHGIVSK | 0.000 | 0.000 | 0.000 | 0.124 | 0.237 | 0.178 | 0.368 | 0.093 | ||
| 2 spectra, VDVSLTER | 0.000 | 0.000 | 0.000 | 0.039 | 0.328 | 0.207 | 0.317 | 0.109 | ||
| 2 spectra, GQTNVGQDGR | 0.000 | 0.000 | 0.000 | 0.271 | 0.171 | 0.138 | 0.336 | 0.084 | ||
| 1 spectrum, VVMAPHEPLVVFVDNYIK | 0.000 | 0.000 | 0.000 | 0.420 | 0.000 | 0.000 | 0.508 | 0.072 |
| Plot | Mito | Lyso or Perox | ER | Golgi | PM | Cytosol | Nucleus | ||||||
| Expt B |
1 peptide |
1 spectrum |
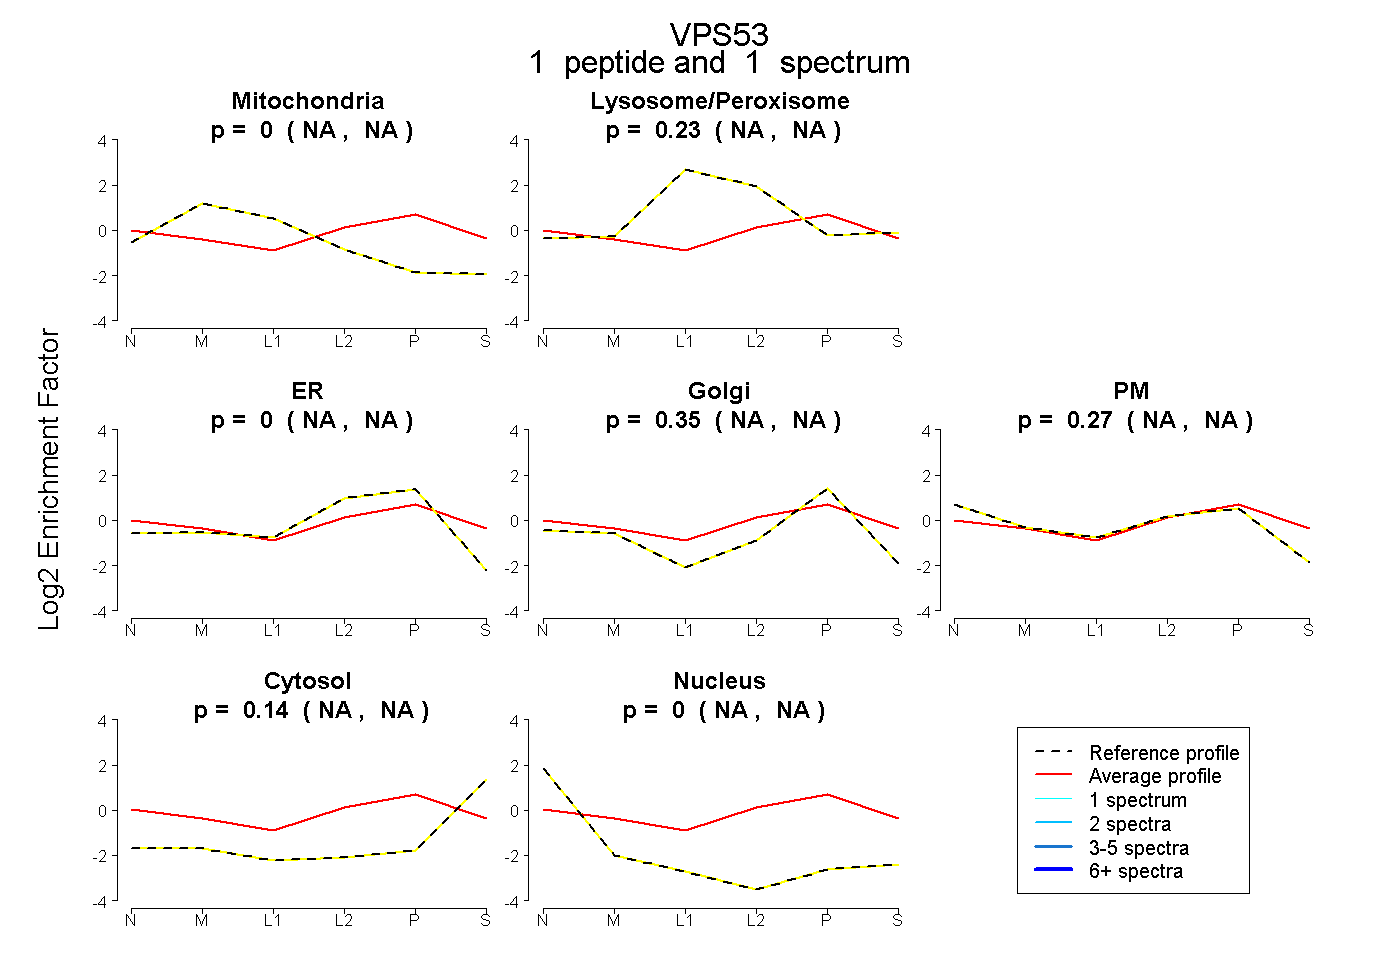 |
0.000 NA | NA |
0.233 NA | NA |
0.000 NA | NA |
0.352 NA | NA |
0.271 NA | NA |
0.144 NA | NA |
0.000 NA | NA |
|||
| Plot | Lyso | Other | |||||||||||
| Expt C |
6 peptides |
11 spectra |
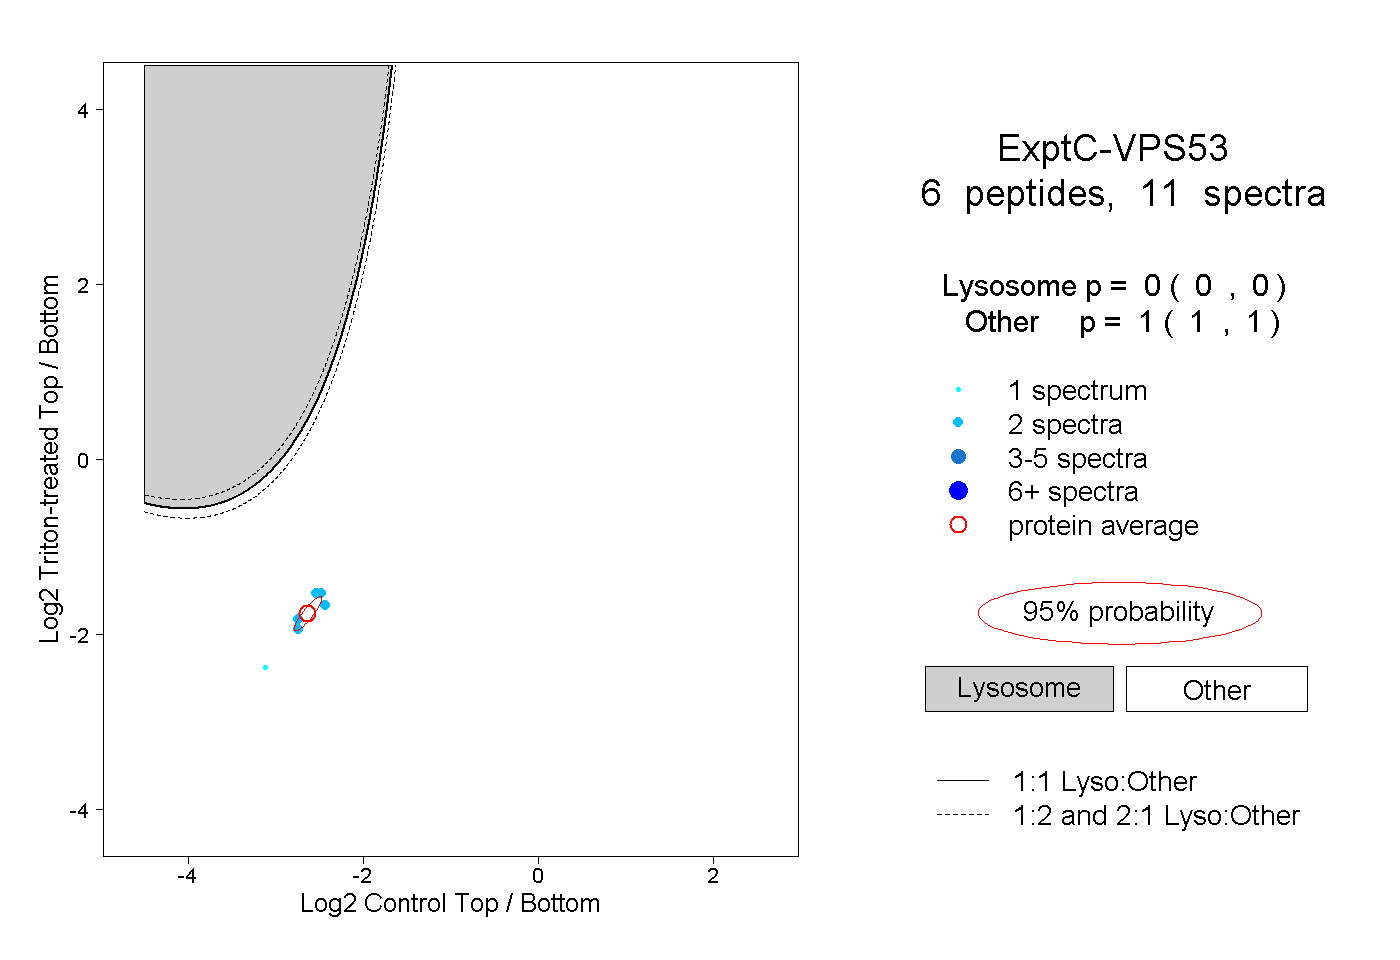 |
0.000 0.000 | 0.000 |
1.000 1.000 | 1.000 |
||||||||
| Plot | Lyso | Other | |||||||||||
| Expt D |
1 peptide |
2 spectra |
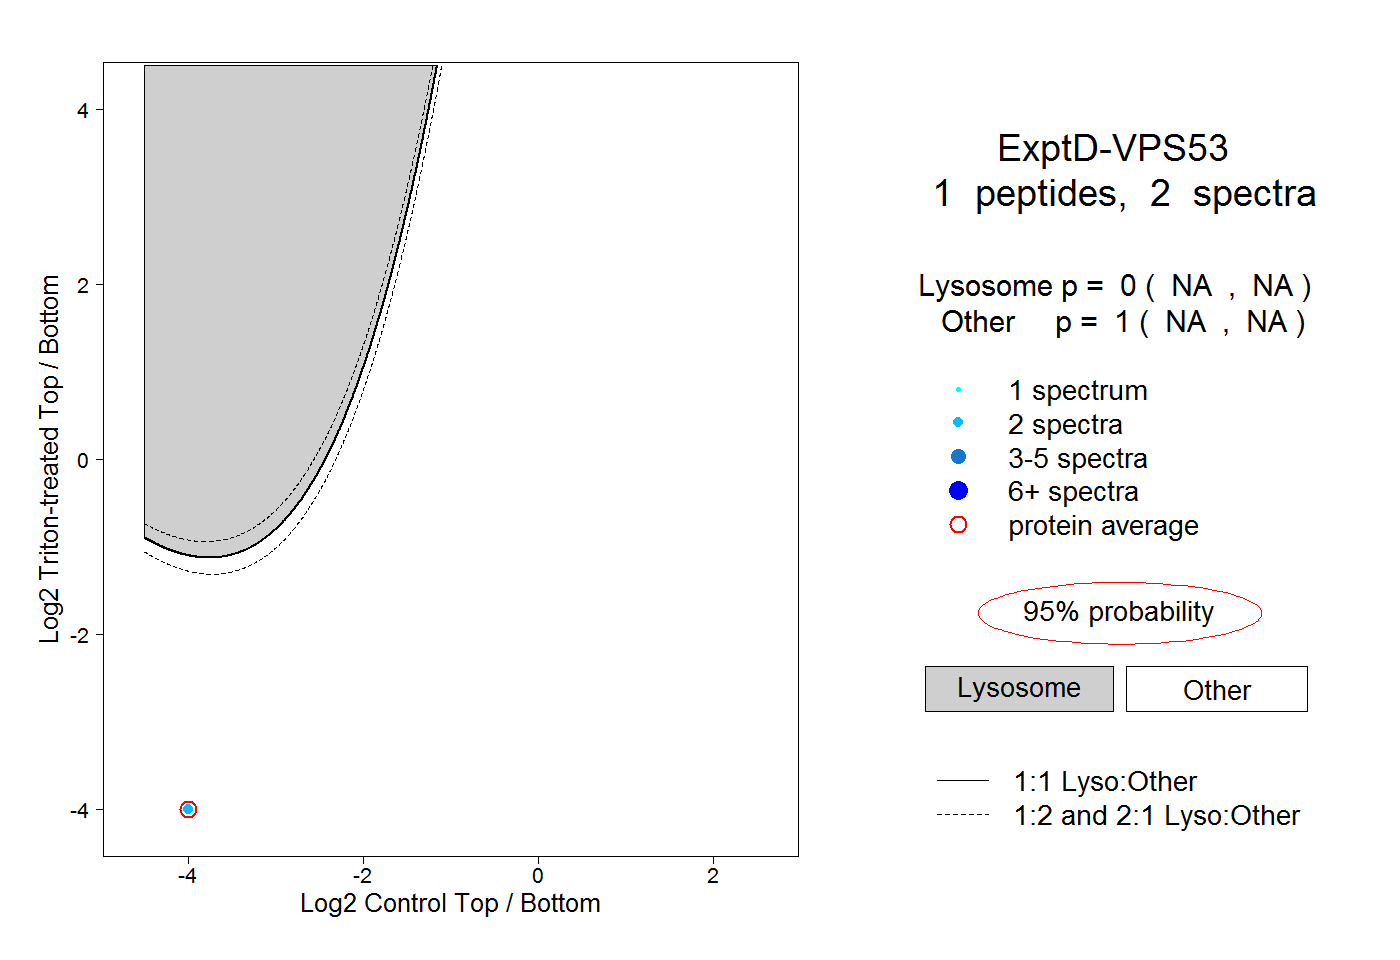 |
0.000 NA | NA |
1.000 NA | NA |