 2
2peptides
spectra
0.073 | 0.135
0.000 | 0.000
0.063 | 0.106
0.000 | 0.133
0.152 | 0.270
0.000 | 0.000
0.497 | 0.541
0.000 | 0.000
| Plot | Mito | Lyso | Perox | ER | Golgi | PM | Cytosol | Nucleus | |||||
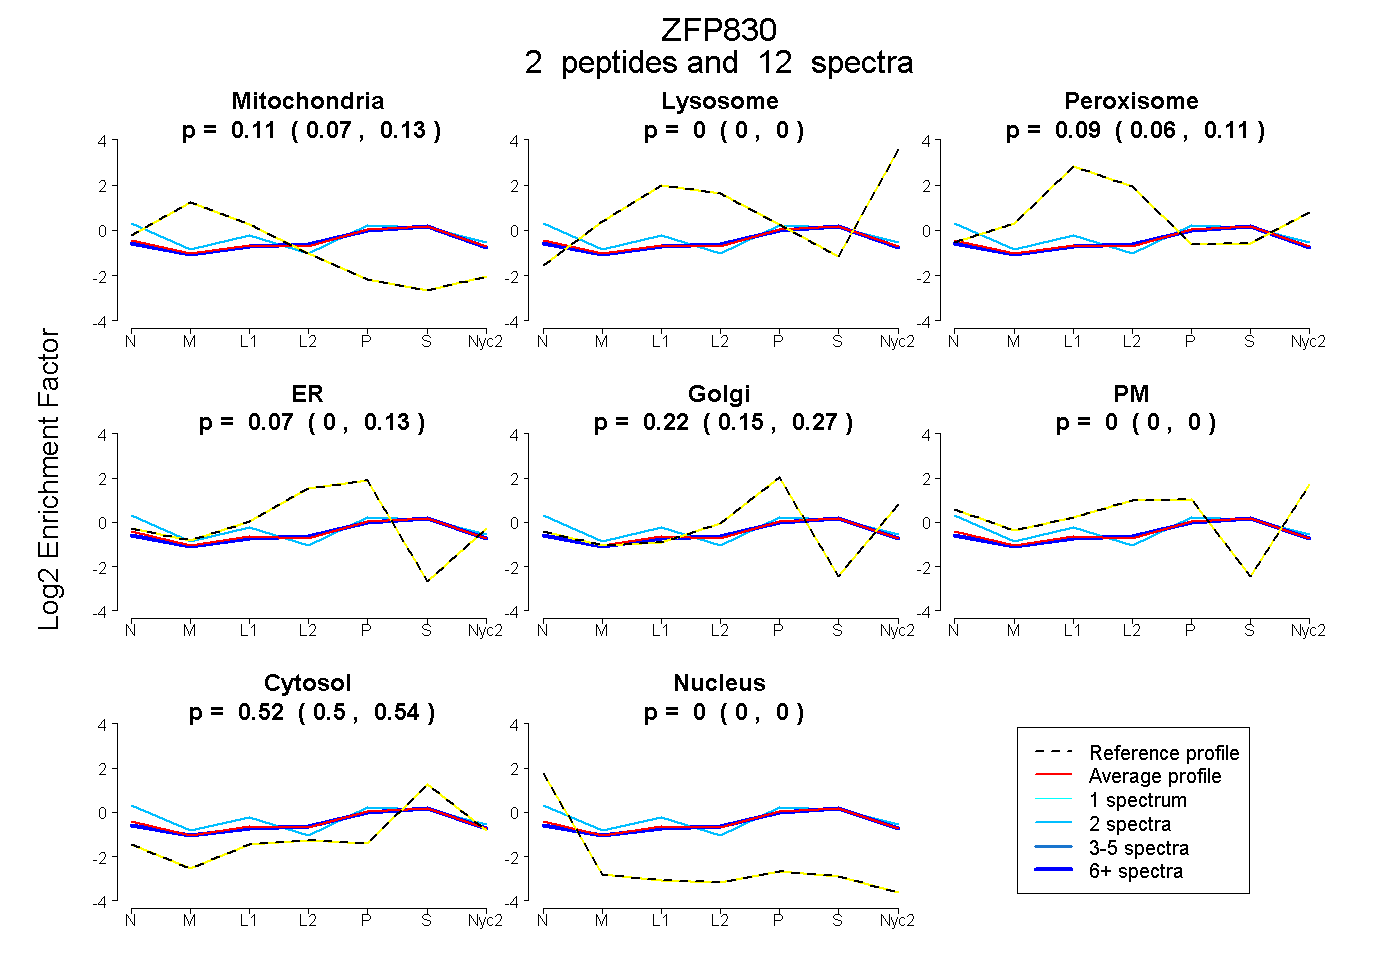
| Expt A |
2 peptides |
12 spectra |
|
0.107 0.073 | 0.135 |
0.000 0.000 | 0.000 |
0.087 0.063 | 0.106 |
0.066 0.000 | 0.133 |
0.219 0.152 | 0.270 |
0.000 0.000 | 0.000 |
0.521 0.497 | 0.541 |
0.000 0.000 | 0.000 |
| 10 spectra, TPAGK | 0.100 | 0.000 | 0.069 | 0.112 | 0.177 | 0.000 | 0.543 | 0.000 | ||
| 2 spectra, APLVPHSGSIEK | 0.036 | 0.000 | 0.213 | 0.000 | 0.249 | 0.025 | 0.383 | 0.093 |
| Plot | Lyso | Other | |||||||||||
| Expt C |
1 peptide |
2 spectra |
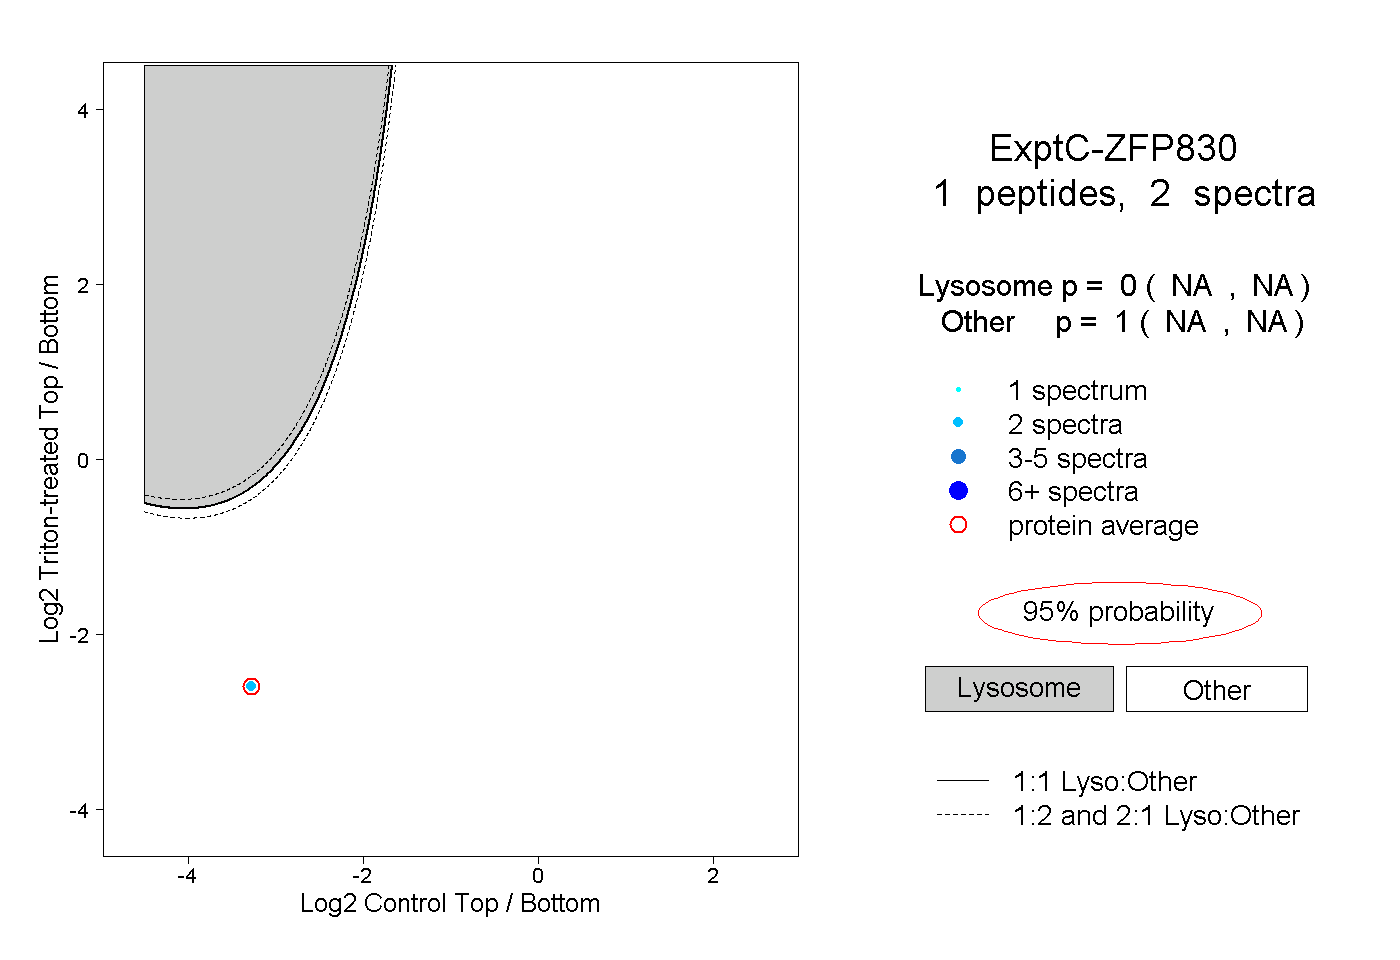 |
0.000 NA | NA |
1.000 NA | NA |