 13
13peptides
spectra
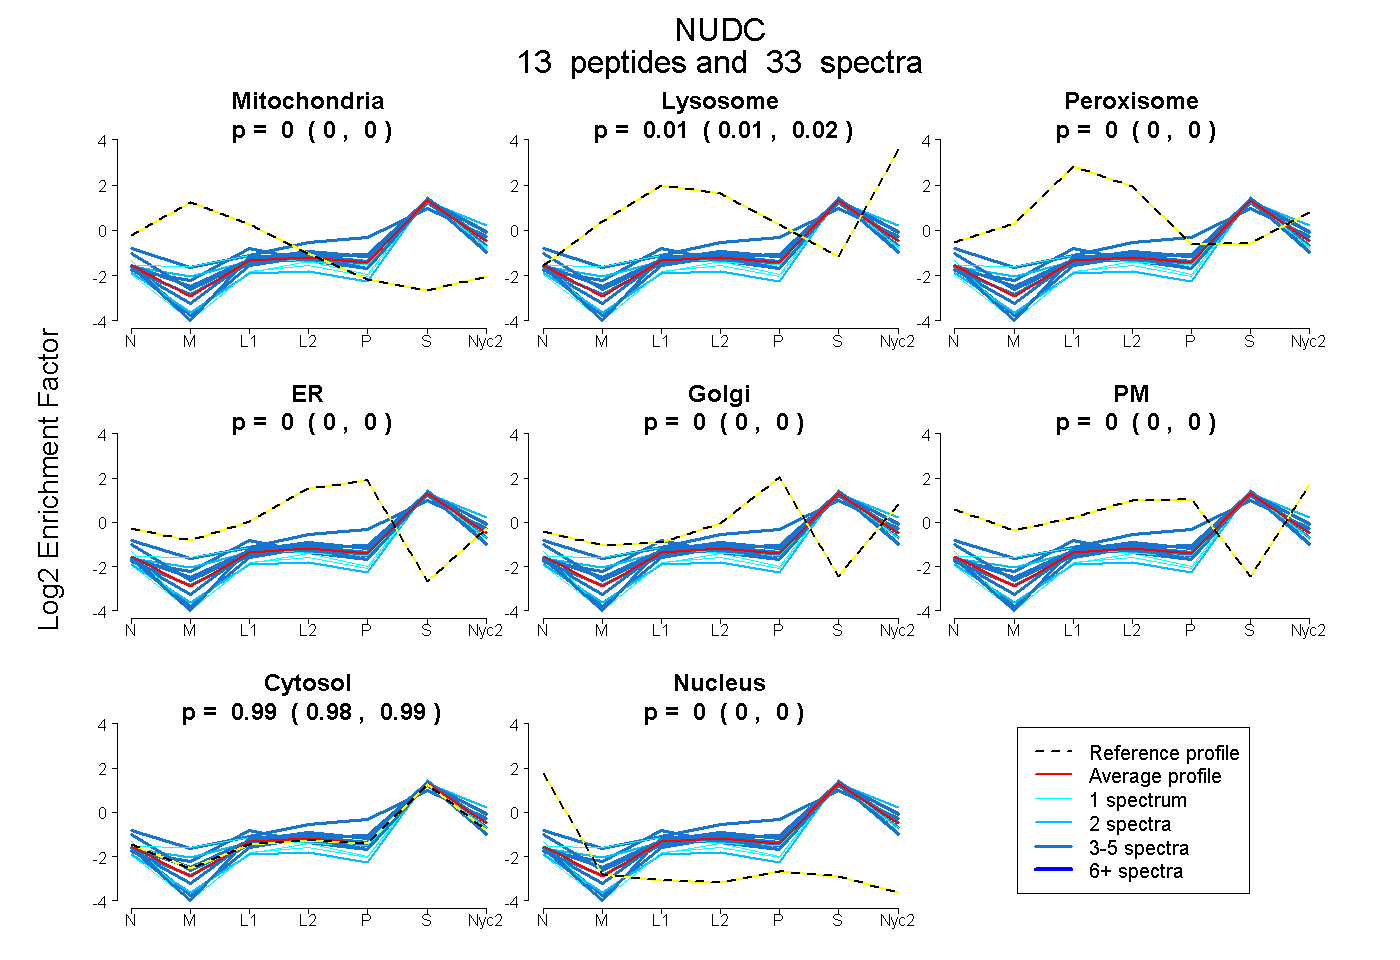
0.000 | 0.000
0.008 | 0.020
0.000 | 0.000
0.000 | 0.000
0.000 | 0.000
0.000 | 0.000
0.979 | 0.990
0.000 | 0.000
2peptides
spectra
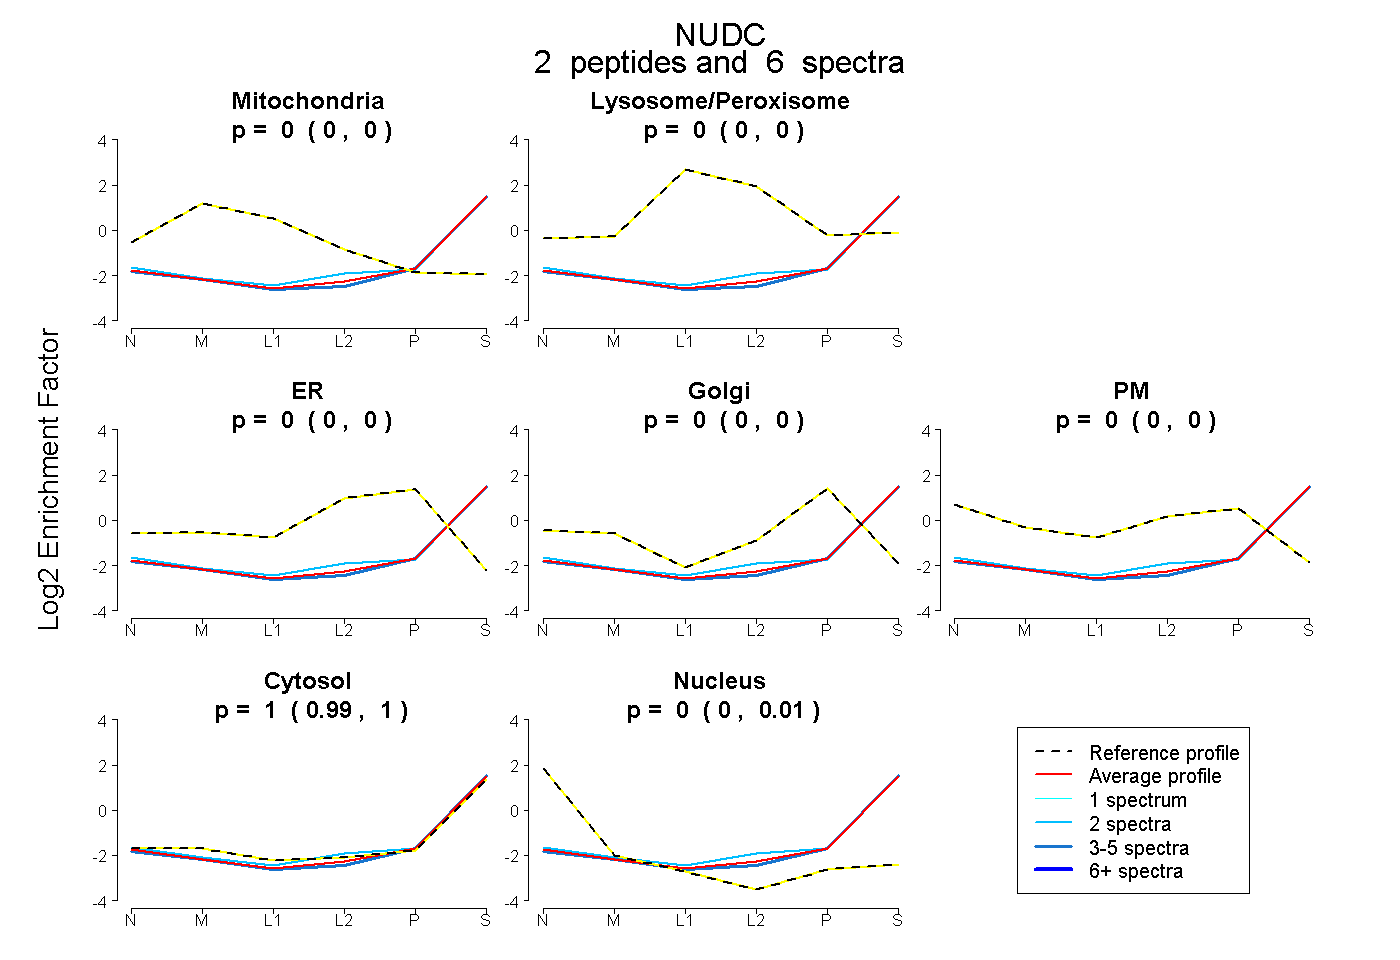
0.000 | 0.000
0.000 | 0.000
0.000 | 0.000
0.000 | 0.000
0.000 | 0.000
0.991 | 1.000
0.000 | 0.006
11peptides
spectra
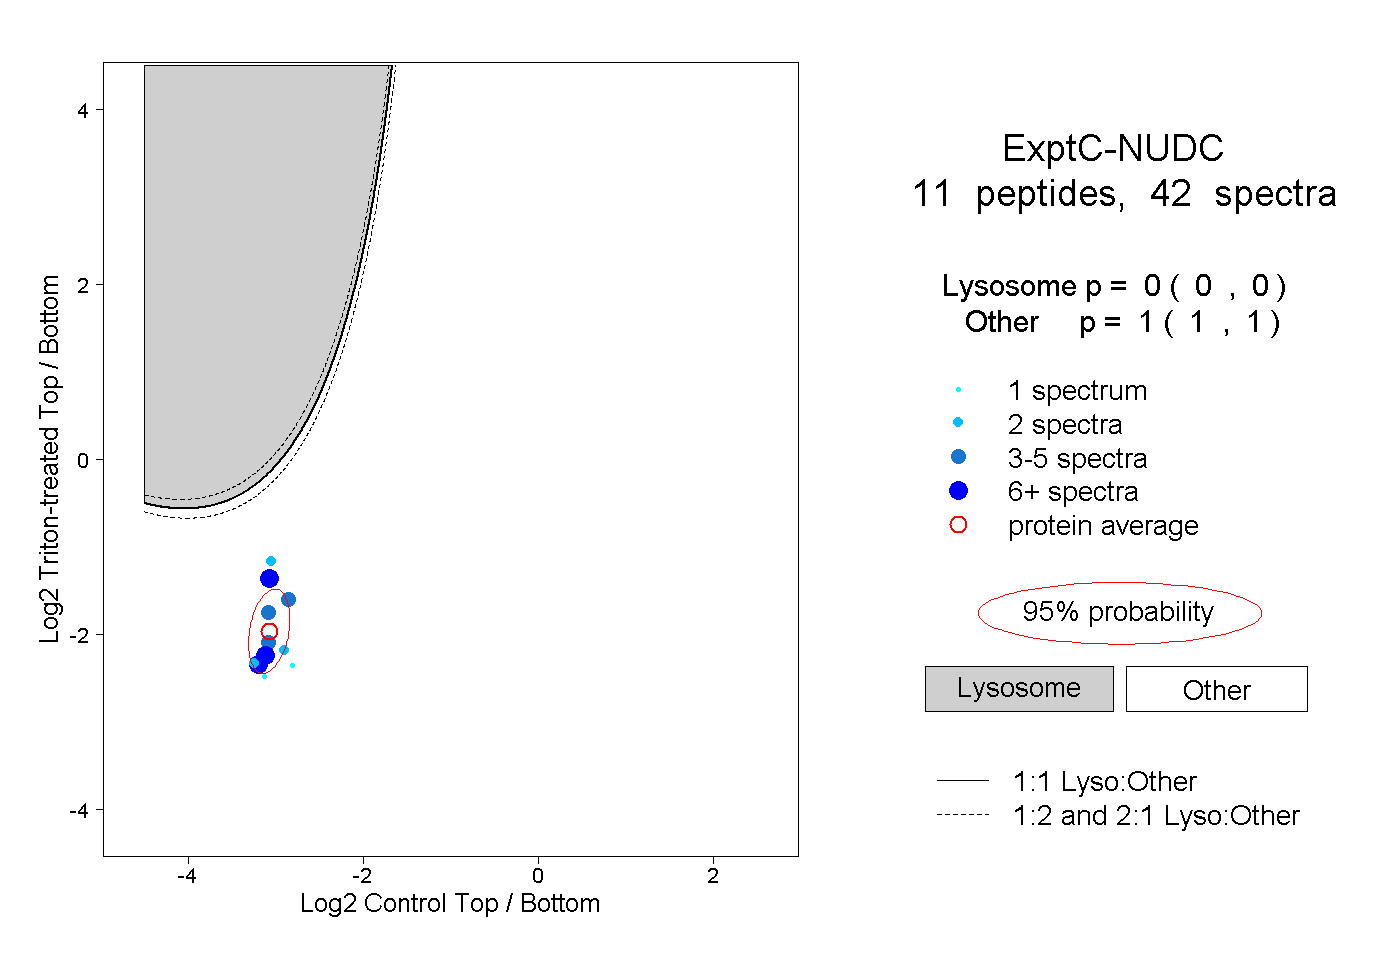
0.000 | 0.000
1.000 | 1.000
