 13
13peptides
spectra
0.000 | 0.000
0.008 | 0.020
0.000 | 0.000
0.000 | 0.000
0.000 | 0.000
0.000 | 0.000
0.979 | 0.990
0.000 | 0.000
| Plot | Mito | Lyso | Perox | ER | Golgi | PM | Cytosol | Nucleus | |||||
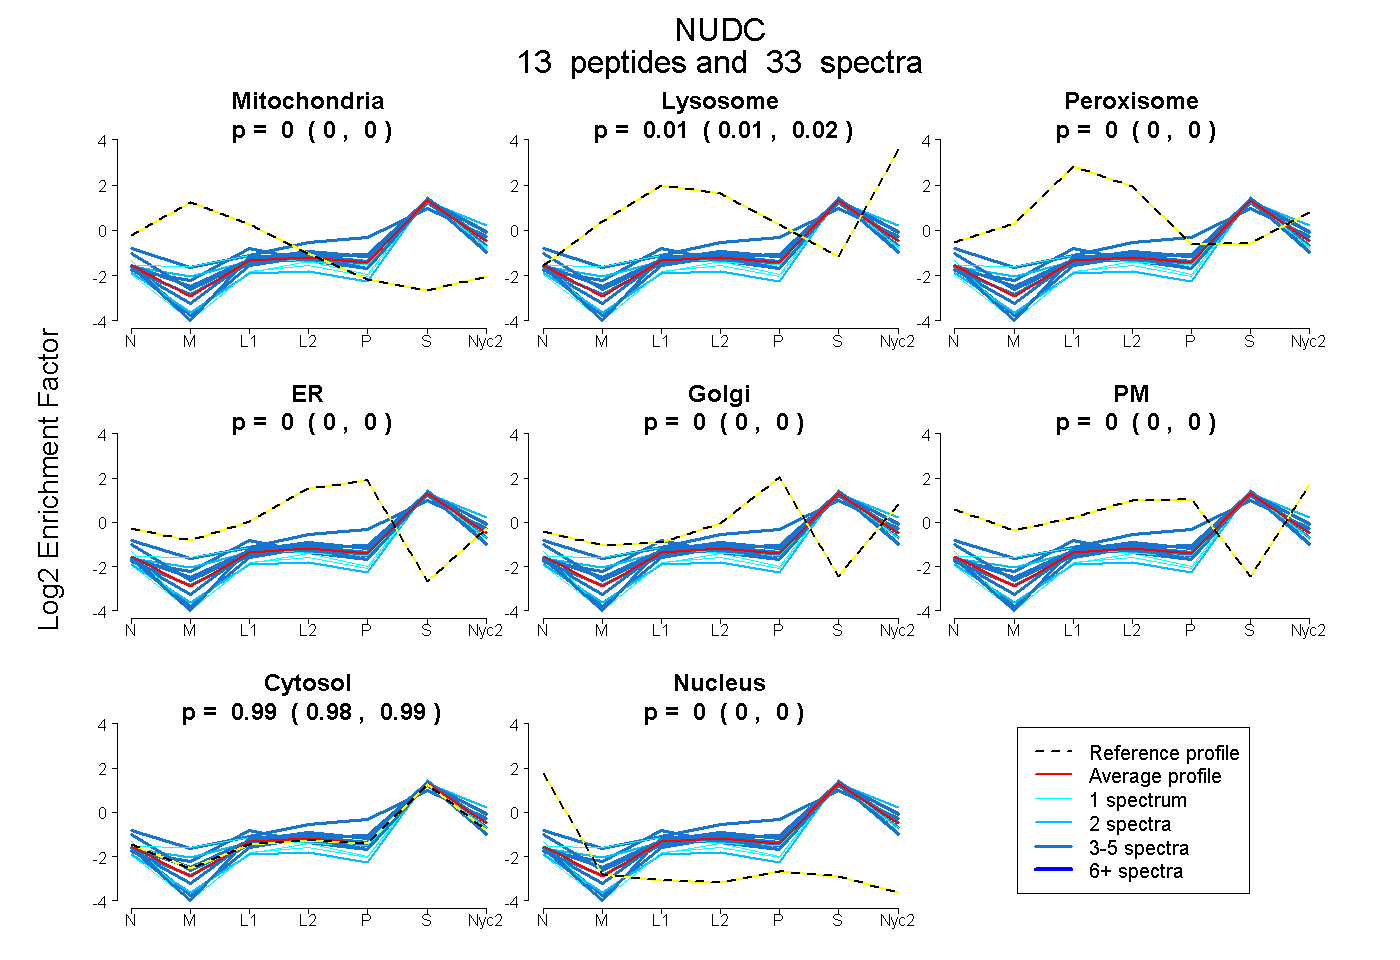
| Expt A |
13 peptides |
33 spectra |
|
0.000 0.000 | 0.000 |
0.014 0.008 | 0.020 |
0.000 0.000 | 0.000 |
0.000 0.000 | 0.000 |
0.000 0.000 | 0.000 |
0.000 0.000 | 0.000 |
0.986 0.979 | 0.990 |
0.000 0.000 | 0.000 |
| 1 spectrum, DAENHEVQLK | 0.000 | 0.000 | 0.000 | 0.000 | 0.000 | 0.000 | 1.000 | 0.000 | ||
| 1 spectrum, MMYDQR | 0.089 | 0.036 | 0.000 | 0.000 | 0.000 | 0.000 | 0.874 | 0.000 | ||
| 4 spectra, SMGLPTSDEQK | 0.000 | 0.000 | 0.000 | 0.000 | 0.000 | 0.000 | 1.000 | 0.000 | ||
| 1 spectrum, LVTSDPEINTK | 0.000 | 0.000 | 0.000 | 0.000 | 0.000 | 0.000 | 0.954 | 0.046 | ||
| 2 spectra, GQAPVIDGELYNEVK | 0.000 | 0.000 | 0.000 | 0.000 | 0.000 | 0.000 | 0.988 | 0.012 | ||
| 3 spectra, AETPGPQIK | 0.000 | 0.000 | 0.000 | 0.000 | 0.000 | 0.000 | 1.000 | 0.000 | ||
| 3 spectra, LSDLDSETR | 0.000 | 0.000 | 0.010 | 0.000 | 0.000 | 0.012 | 0.953 | 0.025 | ||
| 3 spectra, FMDQHPEMDFSK | 0.006 | 0.000 | 0.065 | 0.000 | 0.000 | 0.000 | 0.929 | 0.000 | ||
| 3 spectra, TDFFIGGEEGMAEK | 0.015 | 0.000 | 0.004 | 0.000 | 0.000 | 0.000 | 0.981 | 0.000 | ||
| 3 spectra, VVTVHLEK | 0.000 | 0.061 | 0.000 | 0.000 | 0.000 | 0.000 | 0.939 | 0.000 | ||
| 4 spectra, DVVVDIQR | 0.000 | 0.054 | 0.000 | 0.000 | 0.000 | 0.000 | 0.946 | 0.000 | ||
| 3 spectra, LITQTFNHHNQLAQK | 0.000 | 0.000 | 0.076 | 0.000 | 0.114 | 0.089 | 0.721 | 0.000 | ||
| 2 spectra, LQLEIDQK | 0.000 | 0.104 | 0.000 | 0.000 | 0.000 | 0.000 | 0.896 | 0.000 |
| Plot | Mito | Lyso or Perox | ER | Golgi | PM | Cytosol | Nucleus | ||||||
| Expt B |
2 peptides |
6 spectra |
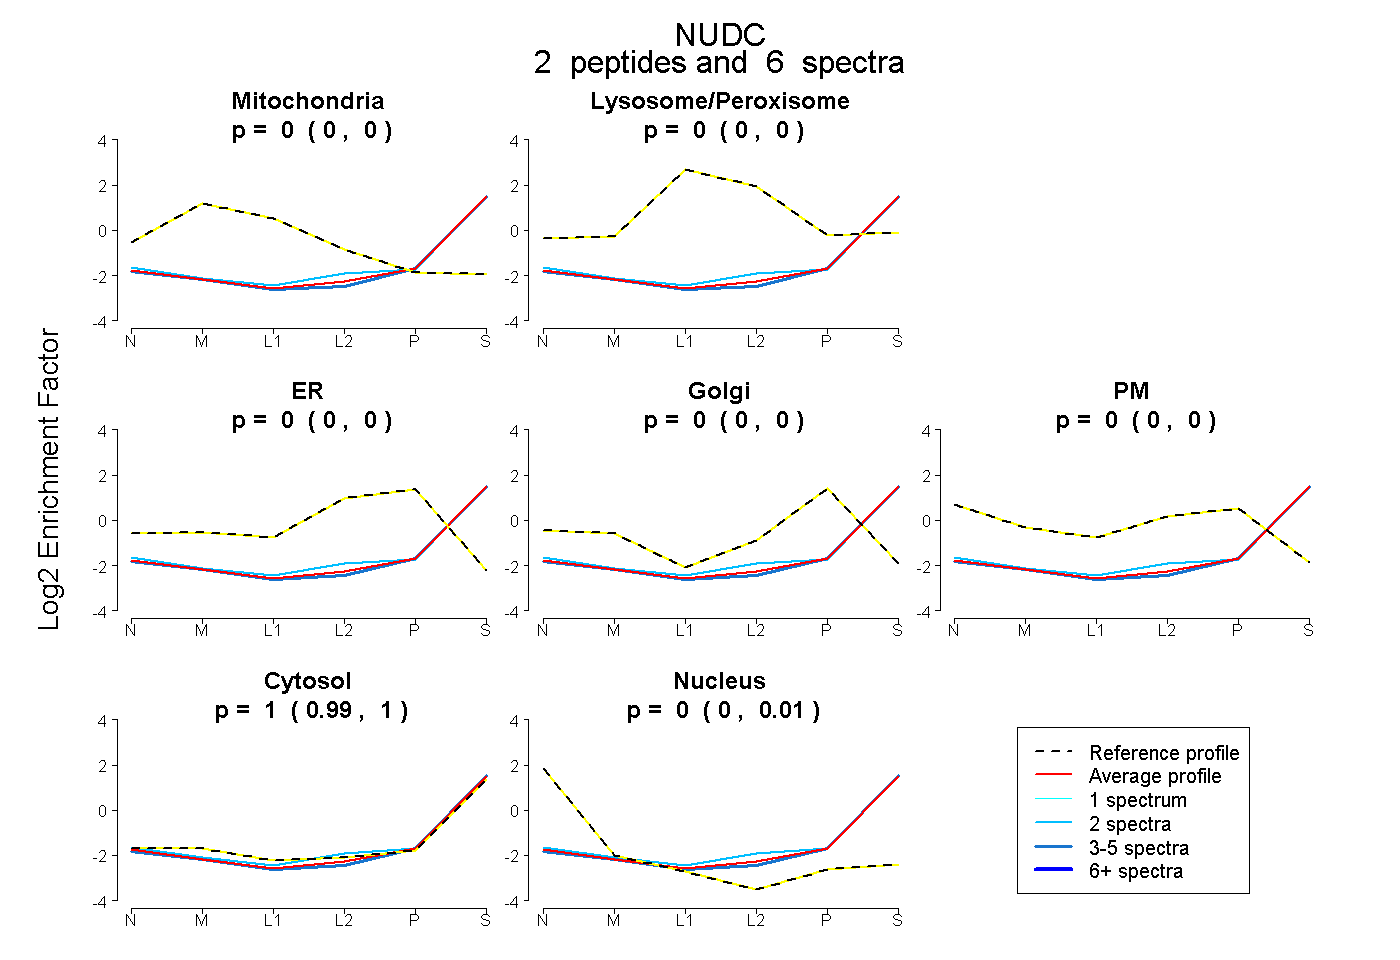 |
0.000 0.000 | 0.000 |
0.000 0.000 | 0.000 |
0.000 0.000 | 0.000 |
0.000 0.000 | 0.000 |
0.000 0.000 | 0.000 |
1.000 0.991 | 1.000 |
0.000 0.000 | 0.006 |
|||
| Plot | Lyso | Other | |||||||||||
| Expt C |
11 peptides |
42 spectra |
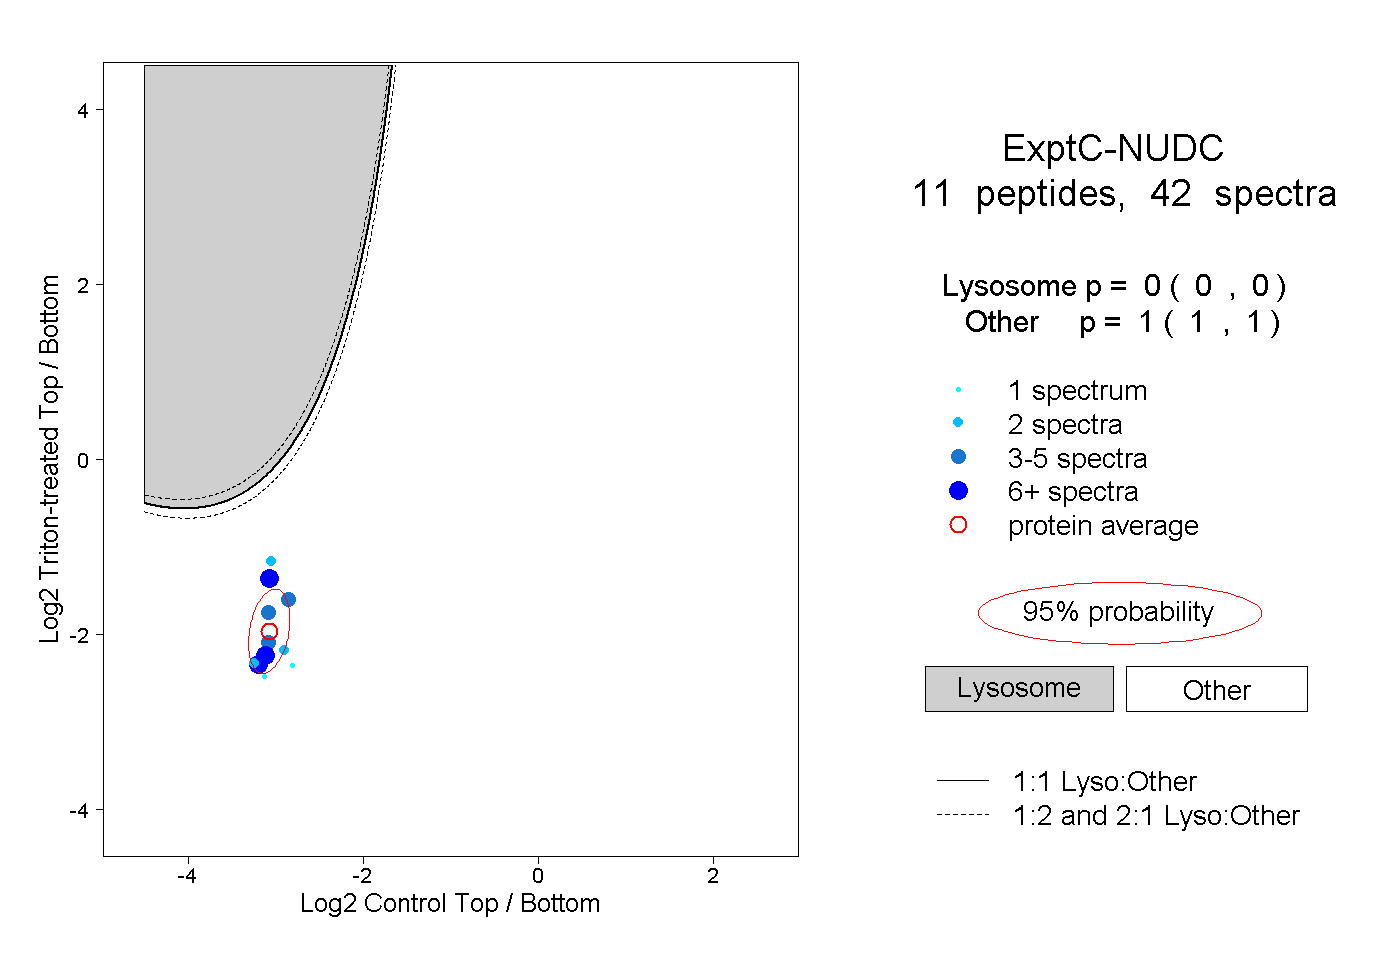 |
0.000 0.000 | 0.000 |
1.000 1.000 | 1.000 |
||||||||
| Plot | Lyso | Other | |||||||||||
| Expt D |
3 peptides |
8 spectra |
 |
0.000 0.000 | 0.005 |
1.000 0.995 | 1.000 |