 6
6peptides
spectra
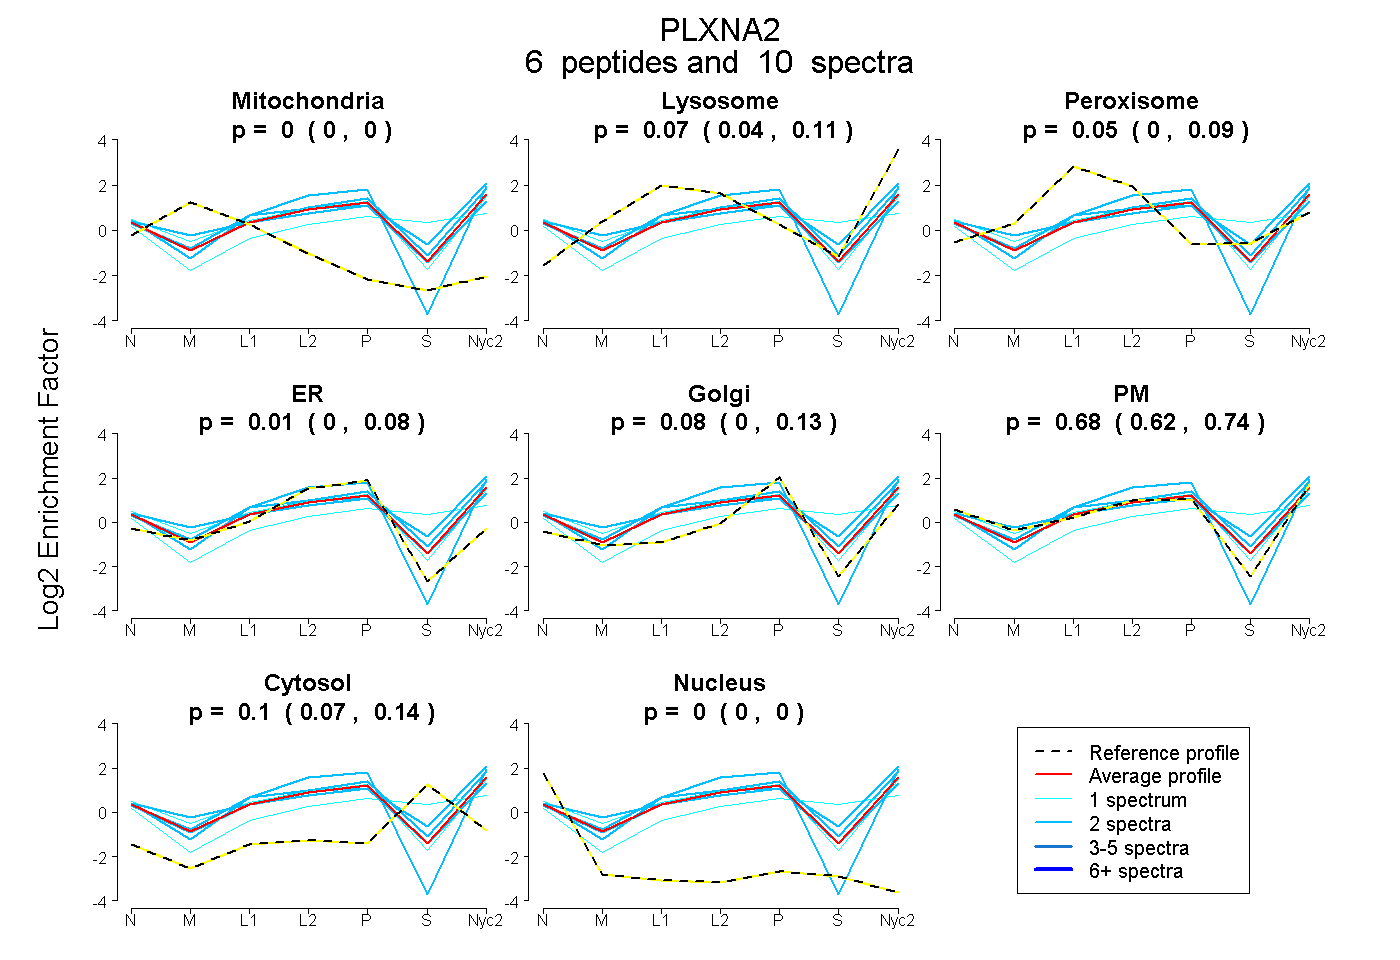
0.000 | 0.000
0.040 | 0.113
0.000 | 0.094
0.000 | 0.084
0.000 | 0.134
0.617 | 0.735
0.065 | 0.138
0.000 | 0.000
1peptide
spectrum
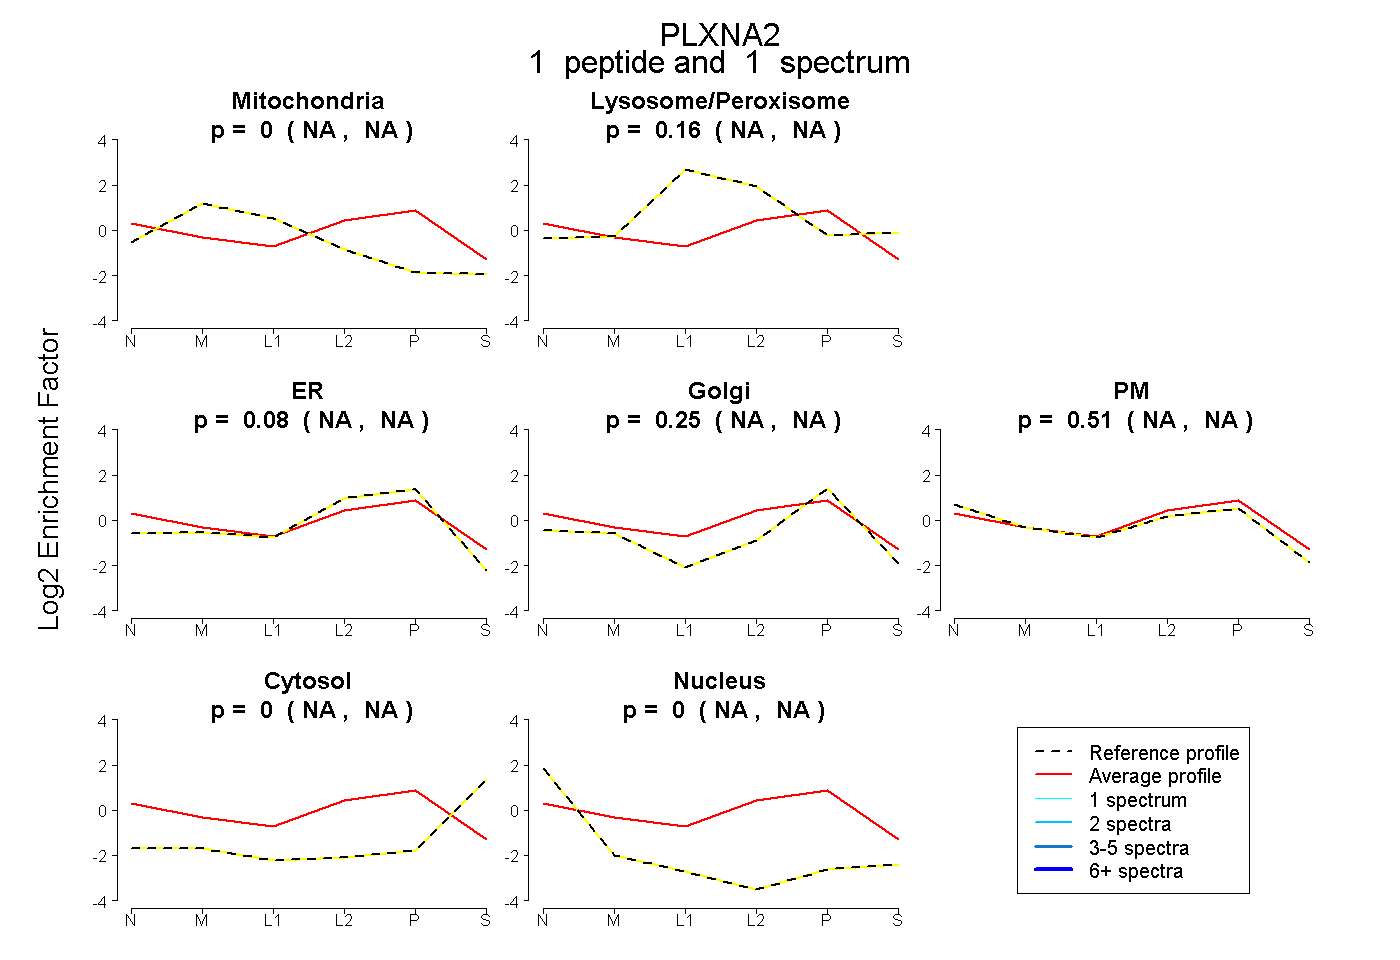
NA | NA
NA | NA
NA | NA
NA | NA
NA | NA
NA | NA
NA | NA
15peptides
spectra
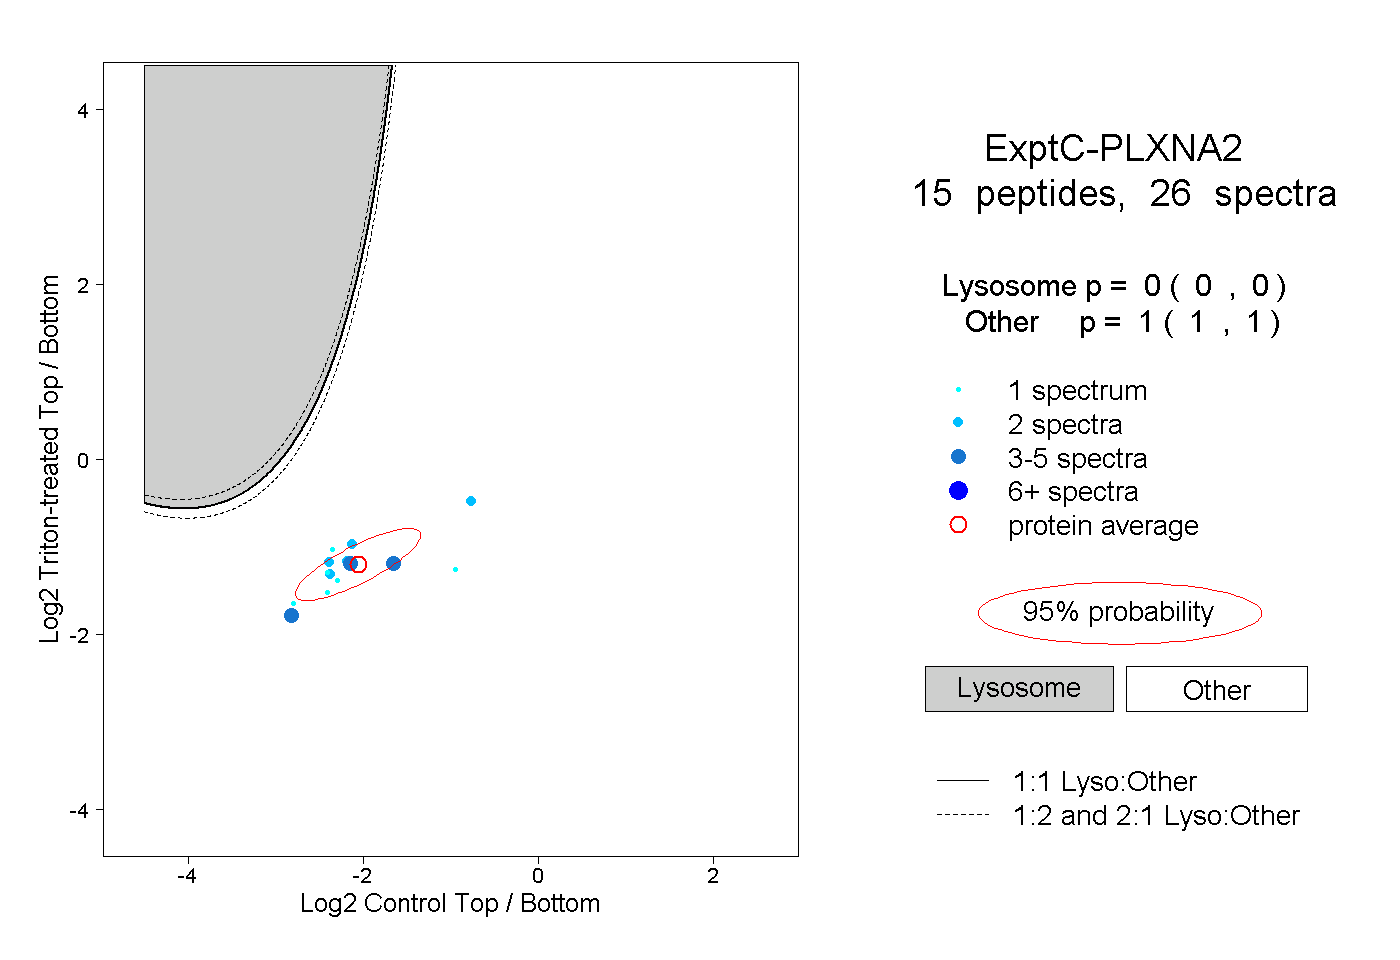
0.000 | 0.000
1.000 | 1.000