 6
6peptides
spectra
0.000 | 0.000
0.040 | 0.113
0.000 | 0.094
0.000 | 0.084
0.000 | 0.134
0.617 | 0.735
0.065 | 0.138
0.000 | 0.000
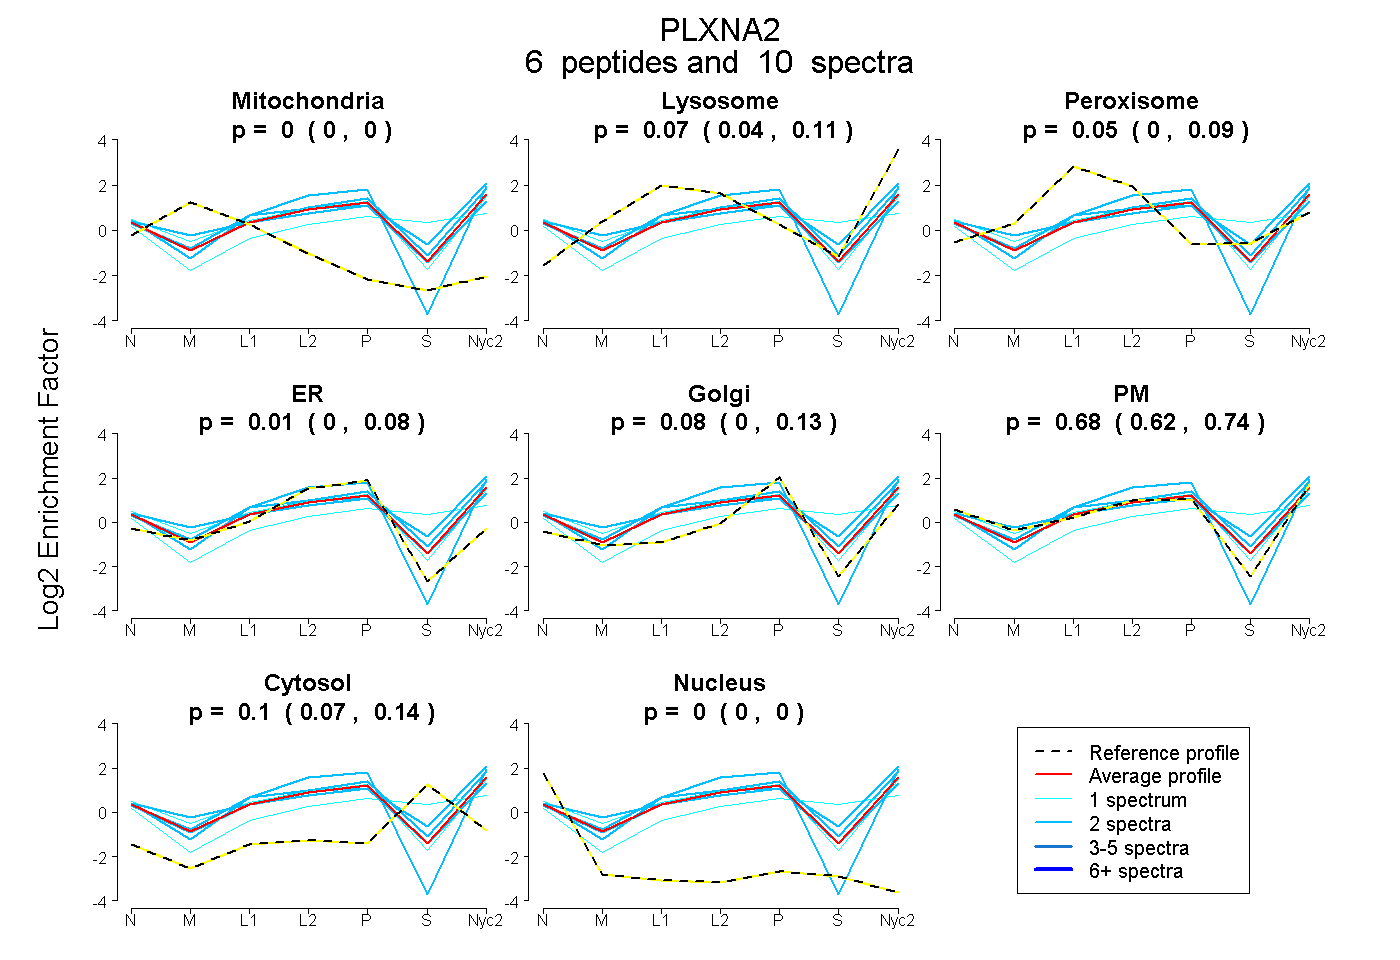
| Plot | Mito | Lyso | Perox | ER | Golgi | PM | Cytosol | Nucleus | |||||
| Expt A |
6 peptides |
10 spectra |
|
0.000 0.000 | 0.000 |
0.074 0.040 | 0.113 |
0.054 0.000 | 0.094 |
0.013 0.000 | 0.084 |
0.079 0.000 | 0.134 |
0.679 0.617 | 0.735 |
0.101 0.065 | 0.138 |
0.000 0.000 | 0.000 |
| 2 spectra, VLFPGIEDHPVLR | 0.000 | 0.238 | 0.010 | 0.000 | 0.000 | 0.589 | 0.164 | 0.000 | ||
| 1 spectrum, GSALPLAIK | 0.000 | 0.006 | 0.029 | 0.000 | 0.000 | 0.493 | 0.472 | 0.000 | ||
| 2 spectra, YMFDFLDEQADR | 0.000 | 0.014 | 0.000 | 0.201 | 0.000 | 0.785 | 0.000 | 0.000 | ||
| 2 spectra, YYADIAK | 0.000 | 0.000 | 0.162 | 0.000 | 0.128 | 0.640 | 0.071 | 0.000 | ||
| 2 spectra, GPIDAITGEAR | 0.000 | 0.171 | 0.000 | 0.000 | 0.082 | 0.638 | 0.108 | 0.000 | ||
| 1 spectrum, VWHLVK | 0.000 | 0.000 | 0.139 | 0.000 | 0.146 | 0.700 | 0.016 | 0.000 |
| Plot | Mito | Lyso or Perox | ER | Golgi | PM | Cytosol | Nucleus | ||||||
| Expt B |
1 peptide |
1 spectrum |
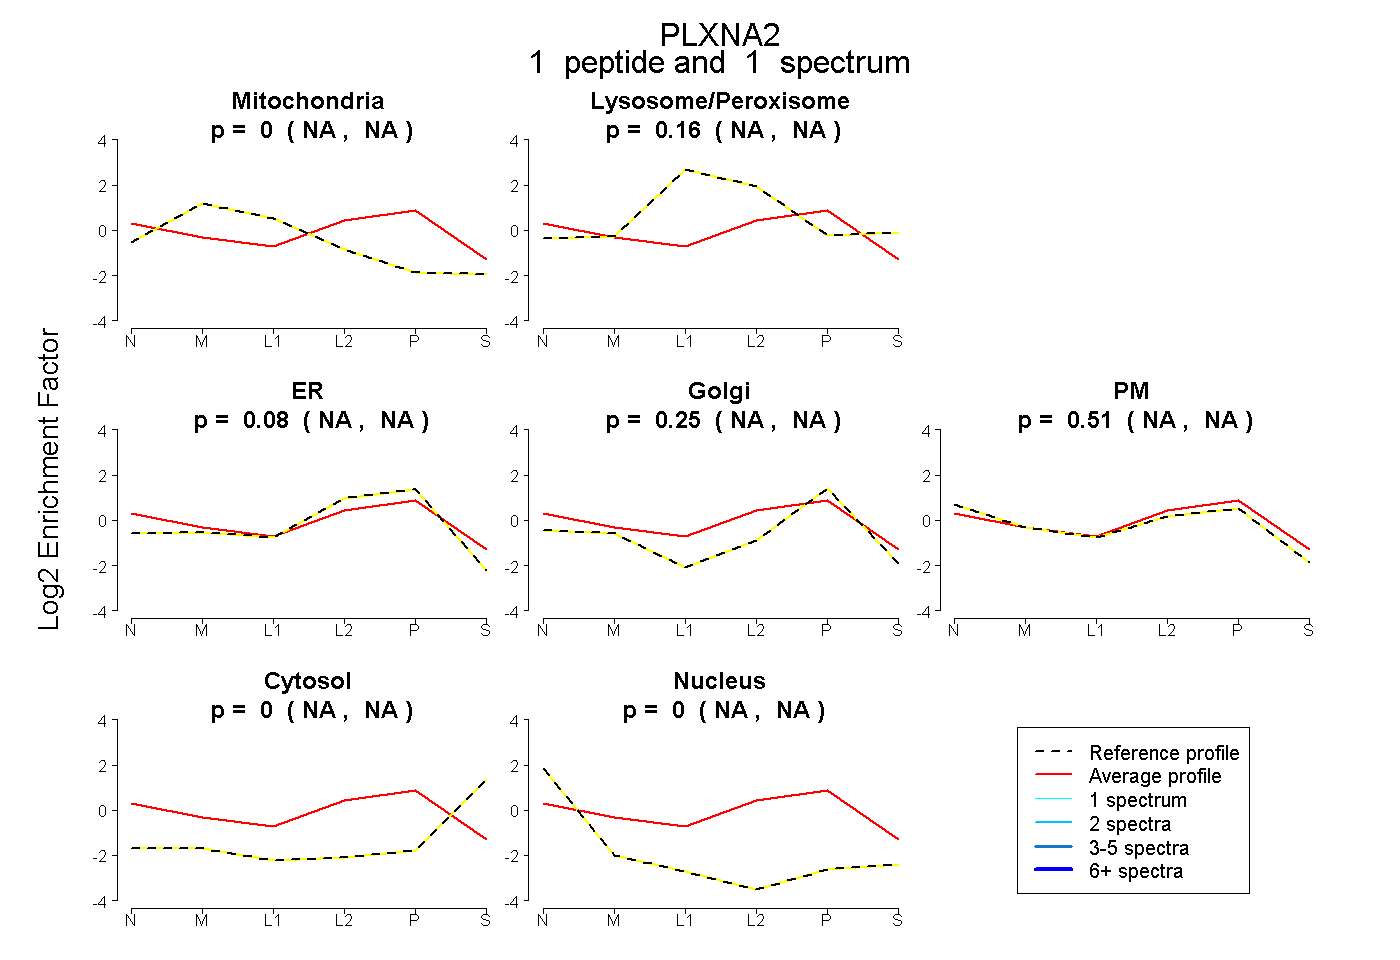 |
0.000 NA | NA |
0.160 NA | NA |
0.080 NA | NA |
0.249 NA | NA |
0.510 NA | NA |
0.000 NA | NA |
0.000 NA | NA |
|||
| Plot | Lyso | Other | |||||||||||
| Expt C |
15 peptides |
26 spectra |
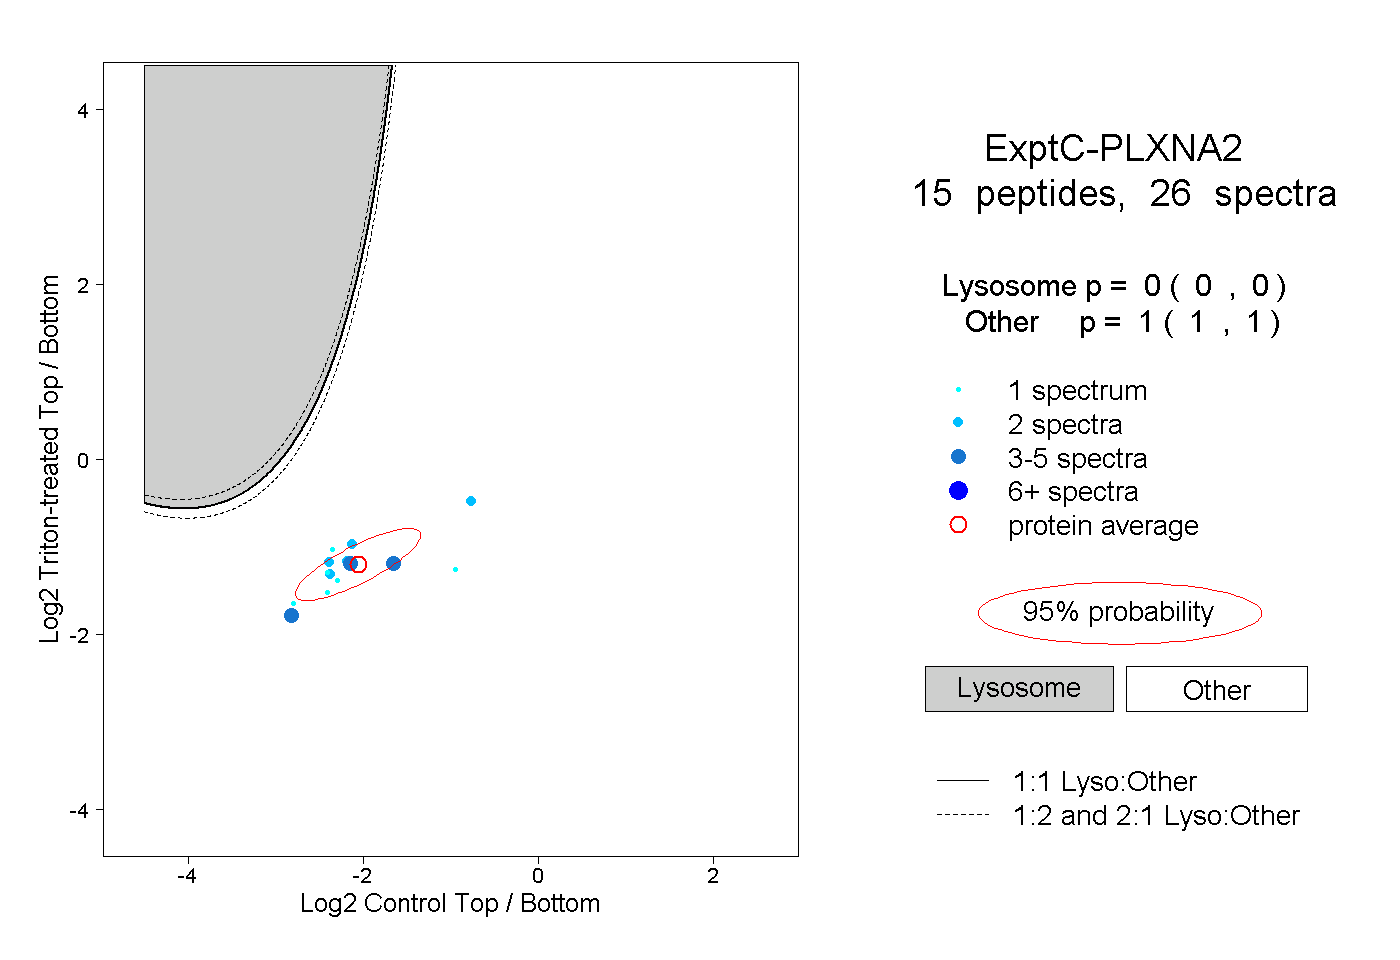 |
0.000 0.000 | 0.000 |
1.000 1.000 | 1.000 |