 1
1peptide
spectra
0.000 | 0.000
0.000 | 0.000
0.000 | 0.000
0.881 | 0.901
0.000 | 0.000
0.000 | 0.000
0.081 | 0.116
0.000 | 0.017
1peptide
spectra
0.000 | 0.000
1.000 | 1.000
| Plot | Mito | Lyso | Perox | ER | Golgi | PM | Cytosol | Nucleus | |||||
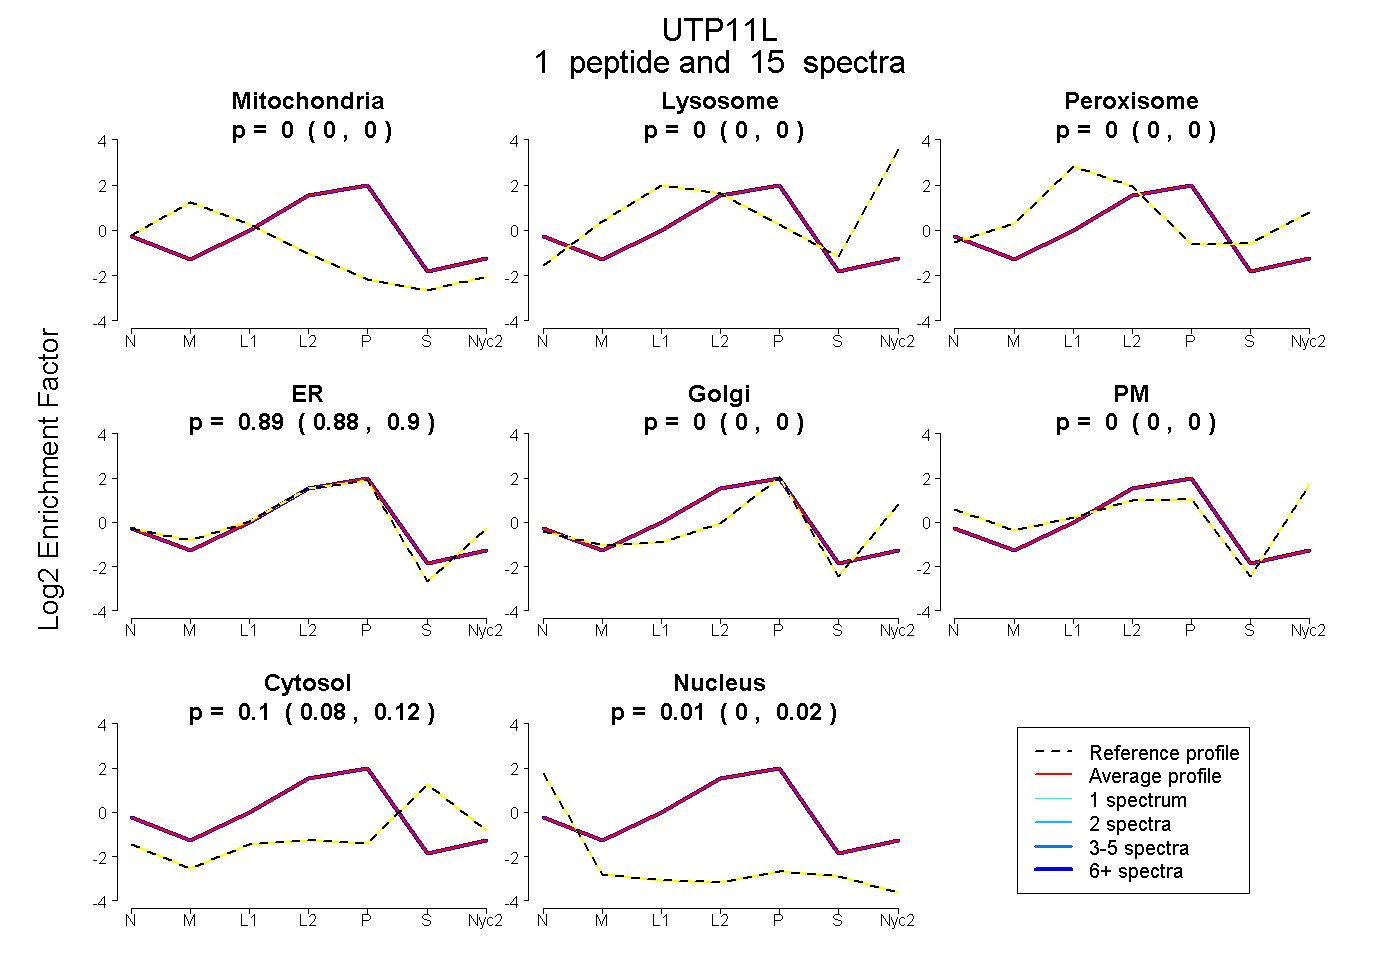
| Expt A |
1 peptide |
15 spectra |
|
0.000 0.000 | 0.000 |
0.000 0.000 | 0.000 |
0.000 0.000 | 0.000 |
0.892 0.881 | 0.901 |
0.000 0.000 | 0.000 |
0.000 0.000 | 0.000 |
0.102 0.081 | 0.116 |
0.006 0.000 | 0.017 |
||
| Plot | Lyso | Other | |||||||||||
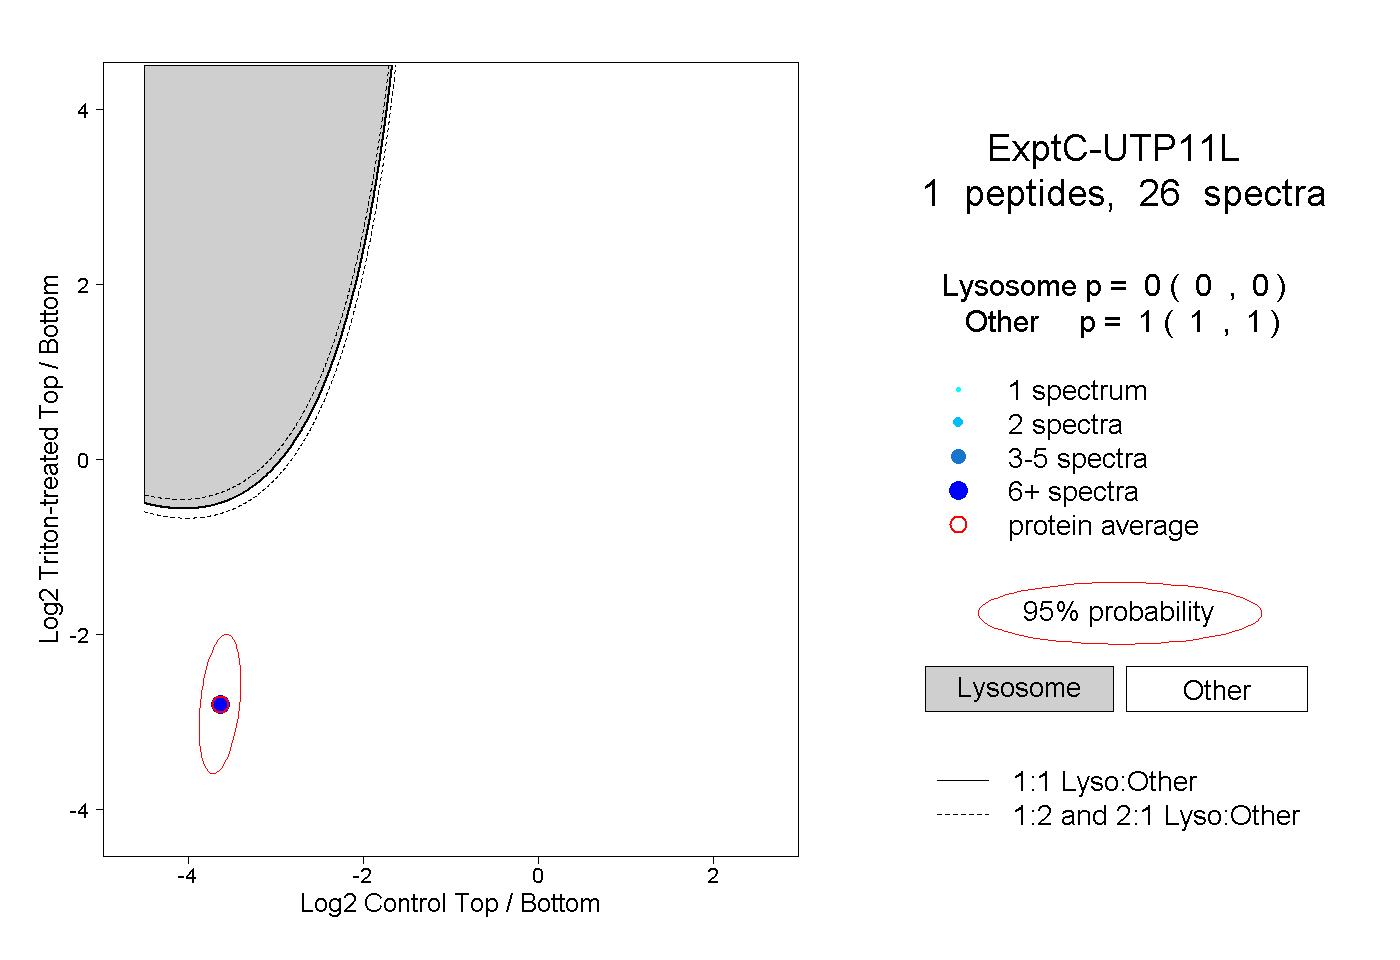
| Expt C |
1 peptide |
26 spectra |
|
0.000 0.000 | 0.000 |
1.000 1.000 | 1.000 |