 3
3peptides
spectra
0.000 | 0.000
0.000 | 0.000
0.000 | 0.064
0.000 | 0.084
0.000 | 0.058
0.425 | 0.553
0.411 | 0.465
0.000 | 0.000
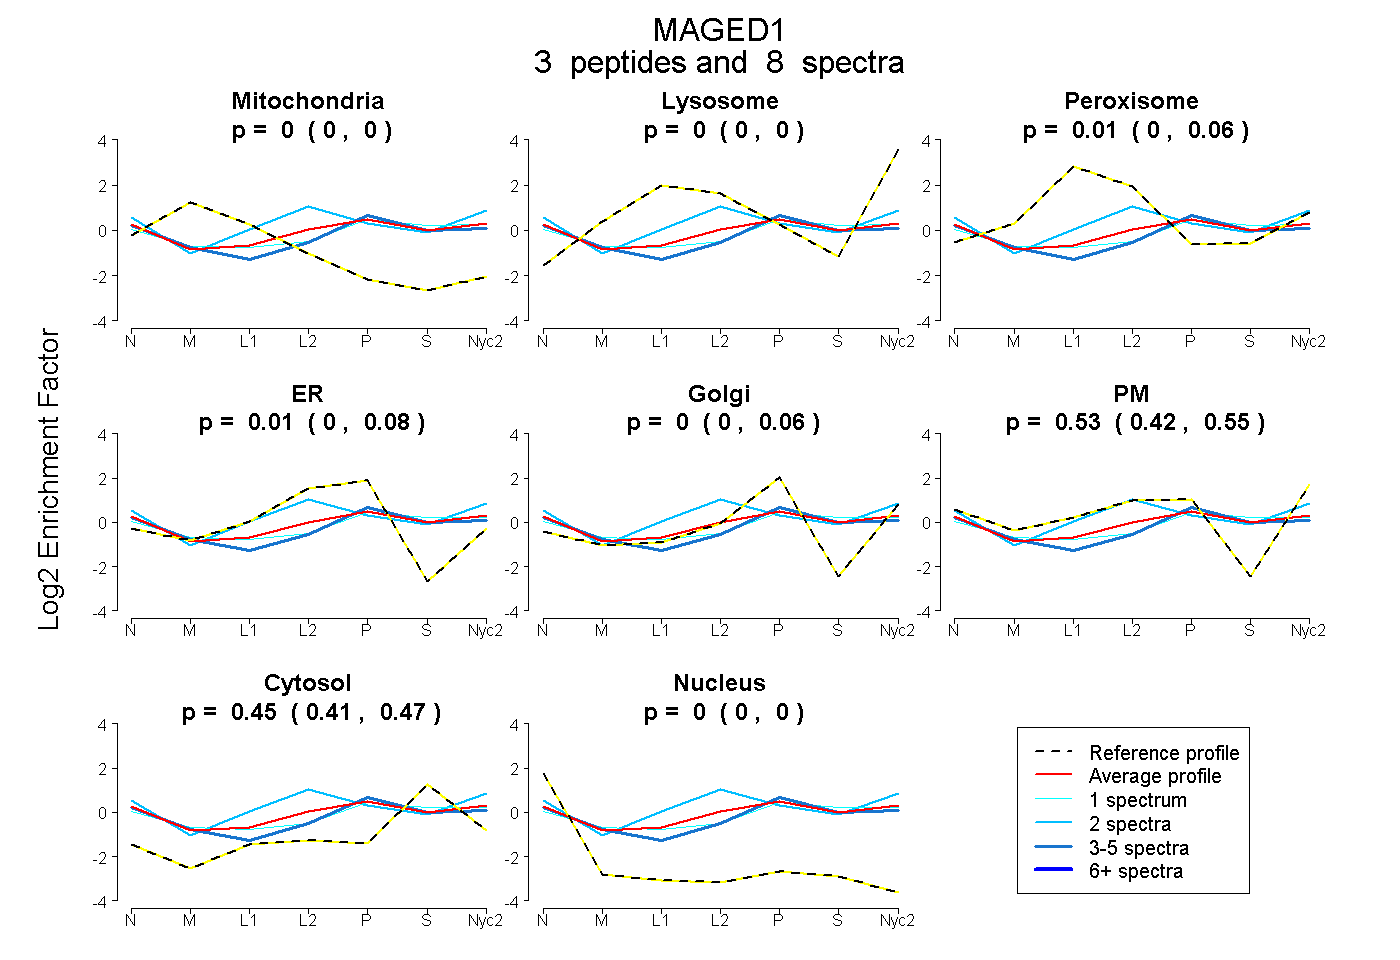
| Plot | Mito | Lyso | Perox | ER | Golgi | PM | Cytosol | Nucleus | |||||
| Expt A |
3 peptides |
8 spectra |
|
0.000 0.000 | 0.000 |
0.000 0.000 | 0.000 |
0.010 0.000 | 0.064 |
0.014 0.000 | 0.084 |
0.000 0.000 | 0.058 |
0.529 0.425 | 0.553 |
0.448 0.411 | 0.465 |
0.000 0.000 | 0.000 |
| 5 spectra, MGLRPGVR | 0.000 | 0.000 | 0.000 | 0.000 | 0.272 | 0.269 | 0.448 | 0.011 | ||
| 2 spectra, ASQNQGPPQPR | 0.000 | 0.000 | 0.205 | 0.000 | 0.000 | 0.496 | 0.299 | 0.000 | ||
| 1 spectrum, ATEAVLWEALR | 0.000 | 0.000 | 0.032 | 0.000 | 0.111 | 0.373 | 0.484 | 0.000 |
| Plot | Lyso | Other | |||||||||||
| Expt C |
1 peptide |
1 spectrum |
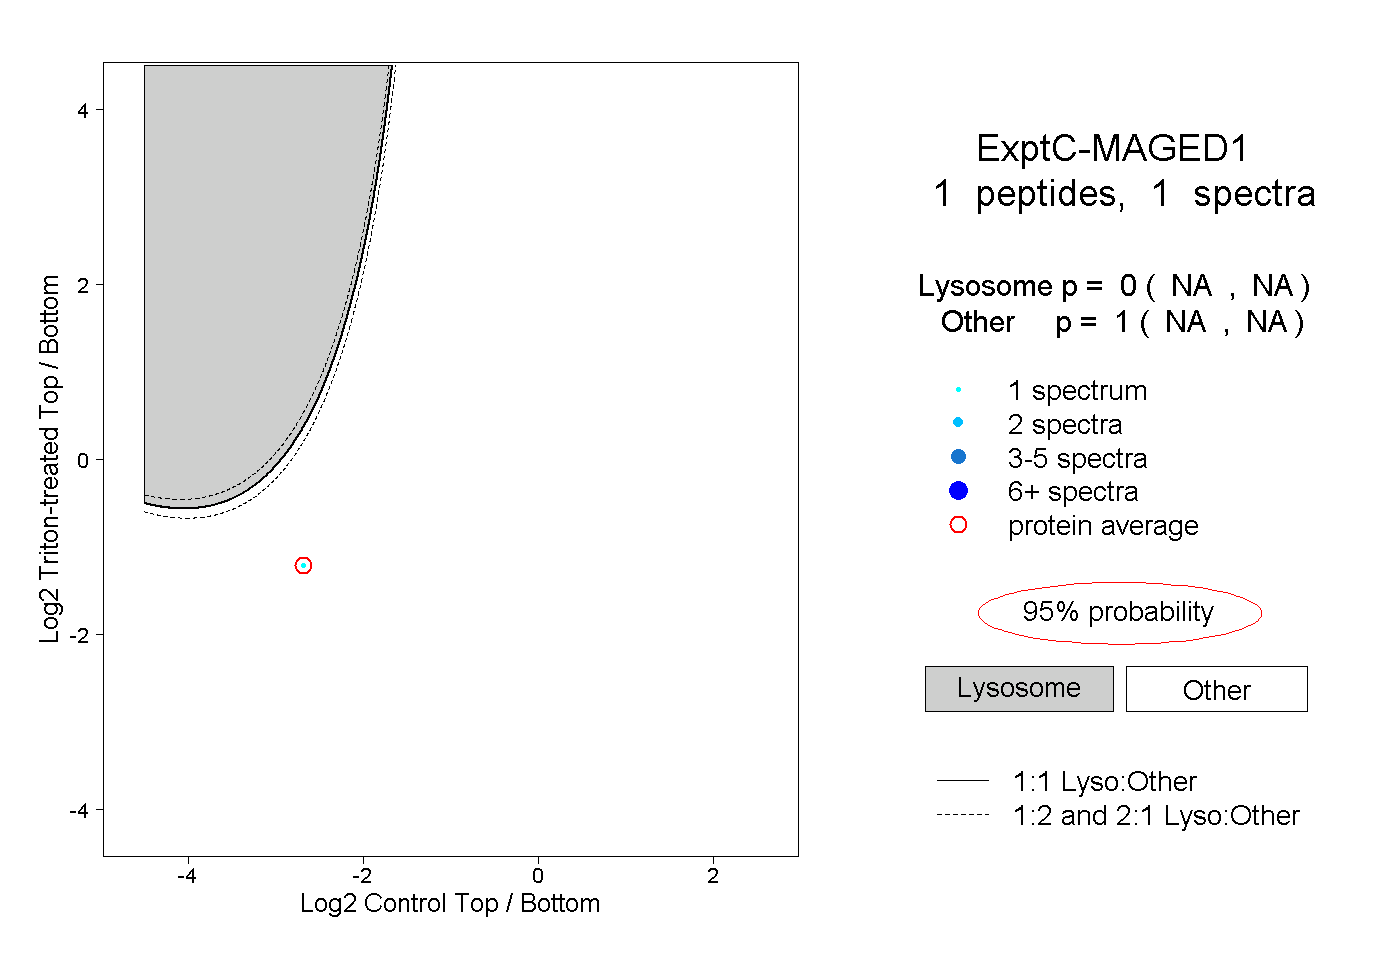 |
0.000 NA | NA |
1.000 NA | NA |