 4
4peptides
spectra
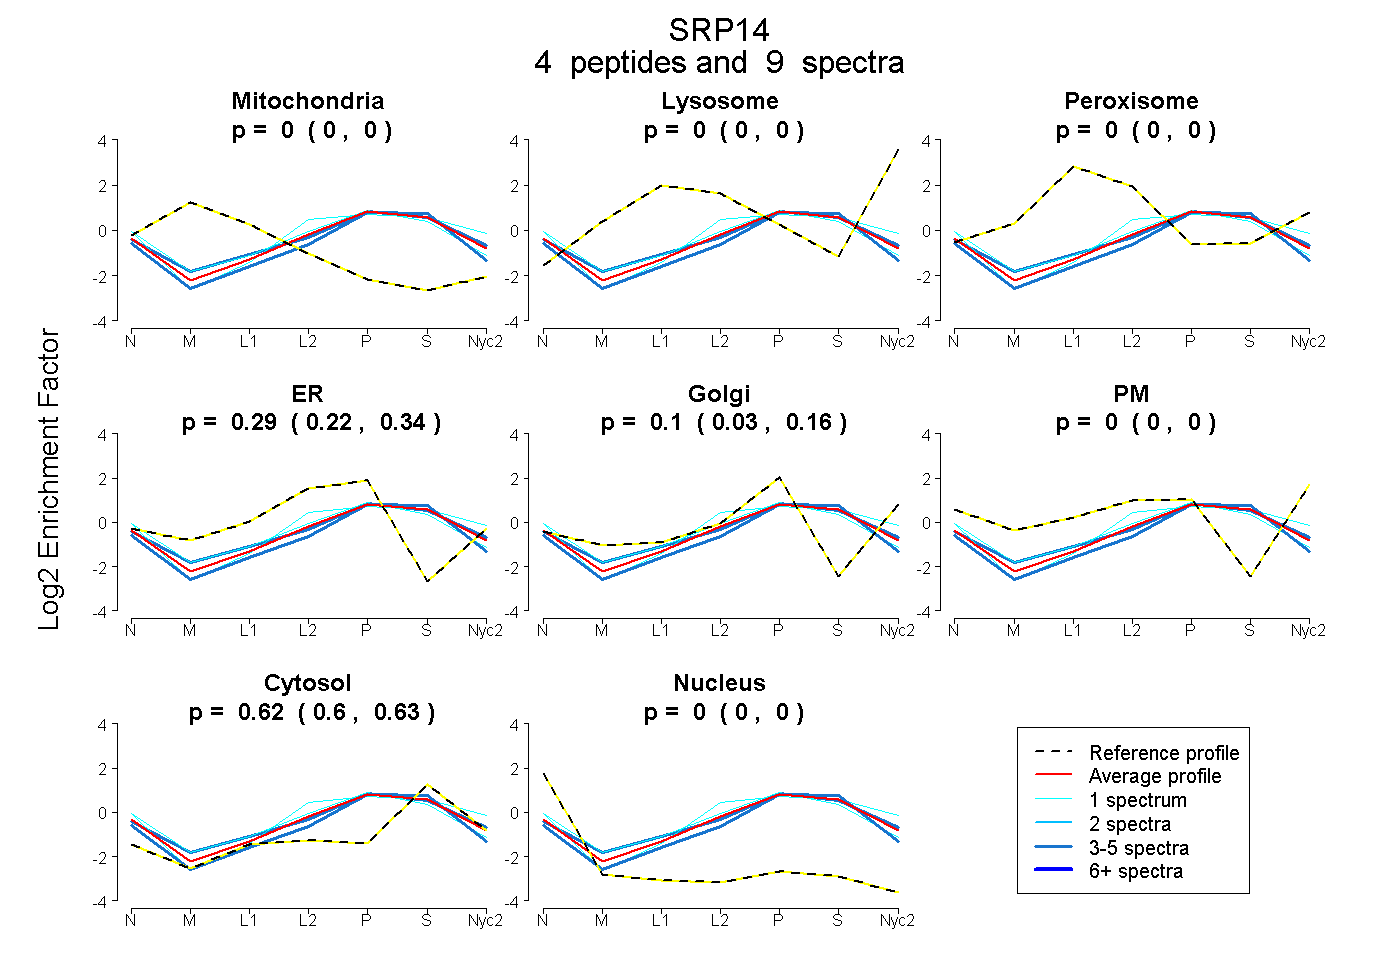
0.000 | 0.000
0.000 | 0.000
0.000 | 0.000
0.221 | 0.340
0.027 | 0.155
0.000 | 0.000
0.602 | 0.629
0.000 | 0.000
2peptides
spectra
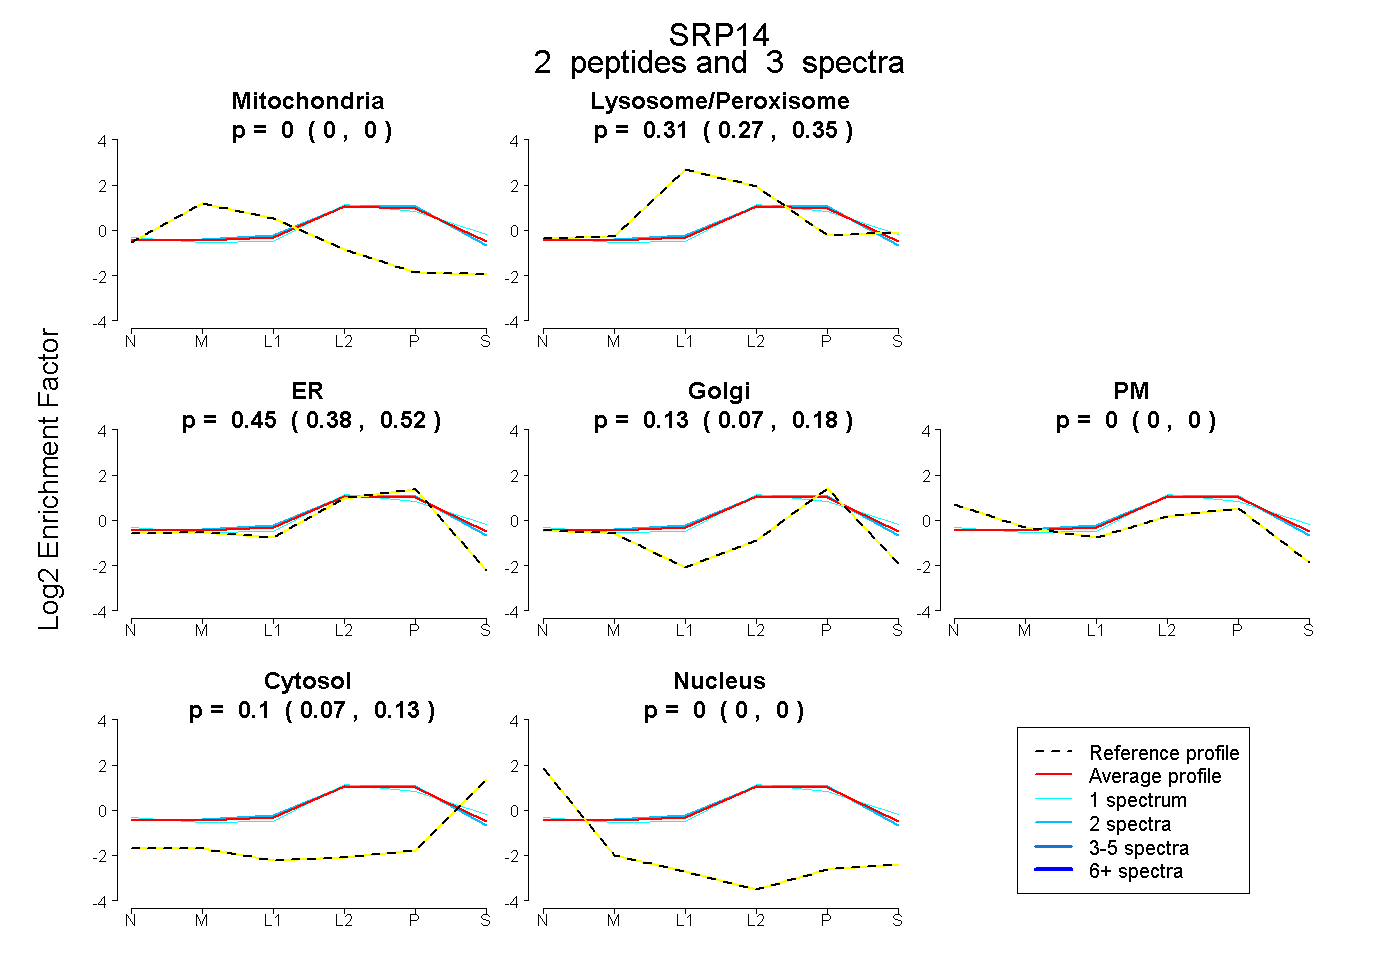
0.000 | 0.000
0.274 | 0.346
0.377 | 0.524
0.070 | 0.184
0.000 | 0.000
0.071 | 0.125
0.000 | 0.000
3peptides
spectra
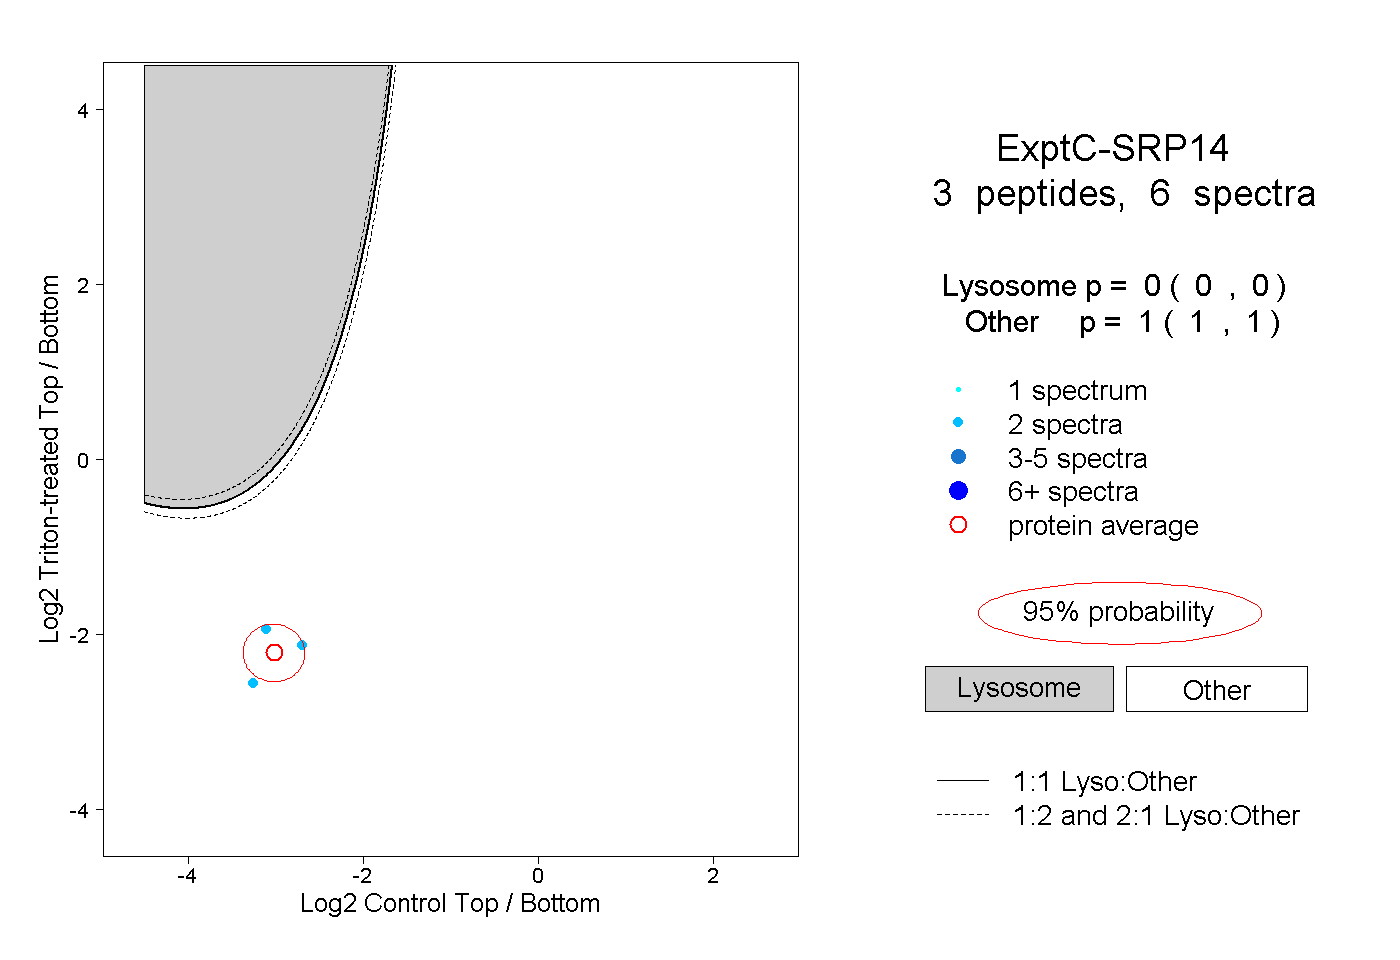
0.000 | 0.000
1.000 | 1.000