14
14peptides
spectra
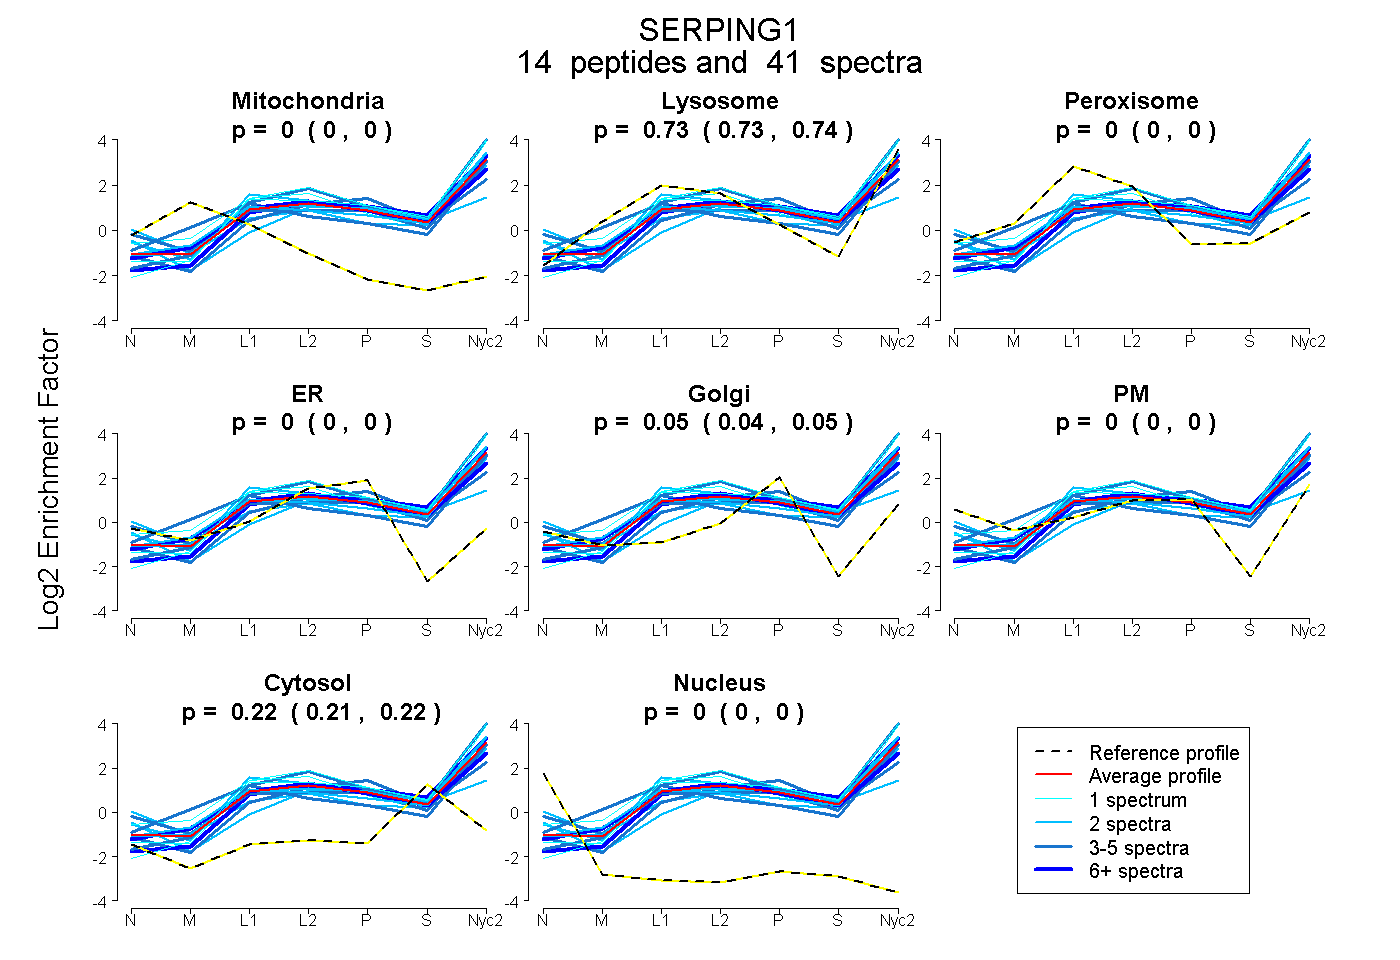
0.000 | 0.000
0.726 | 0.741
0.000 | 0.000
0.000 | 0.000
0.041 | 0.054
0.000 | 0.000
0.212 | 0.222
0.000 | 0.000
7peptides
spectra
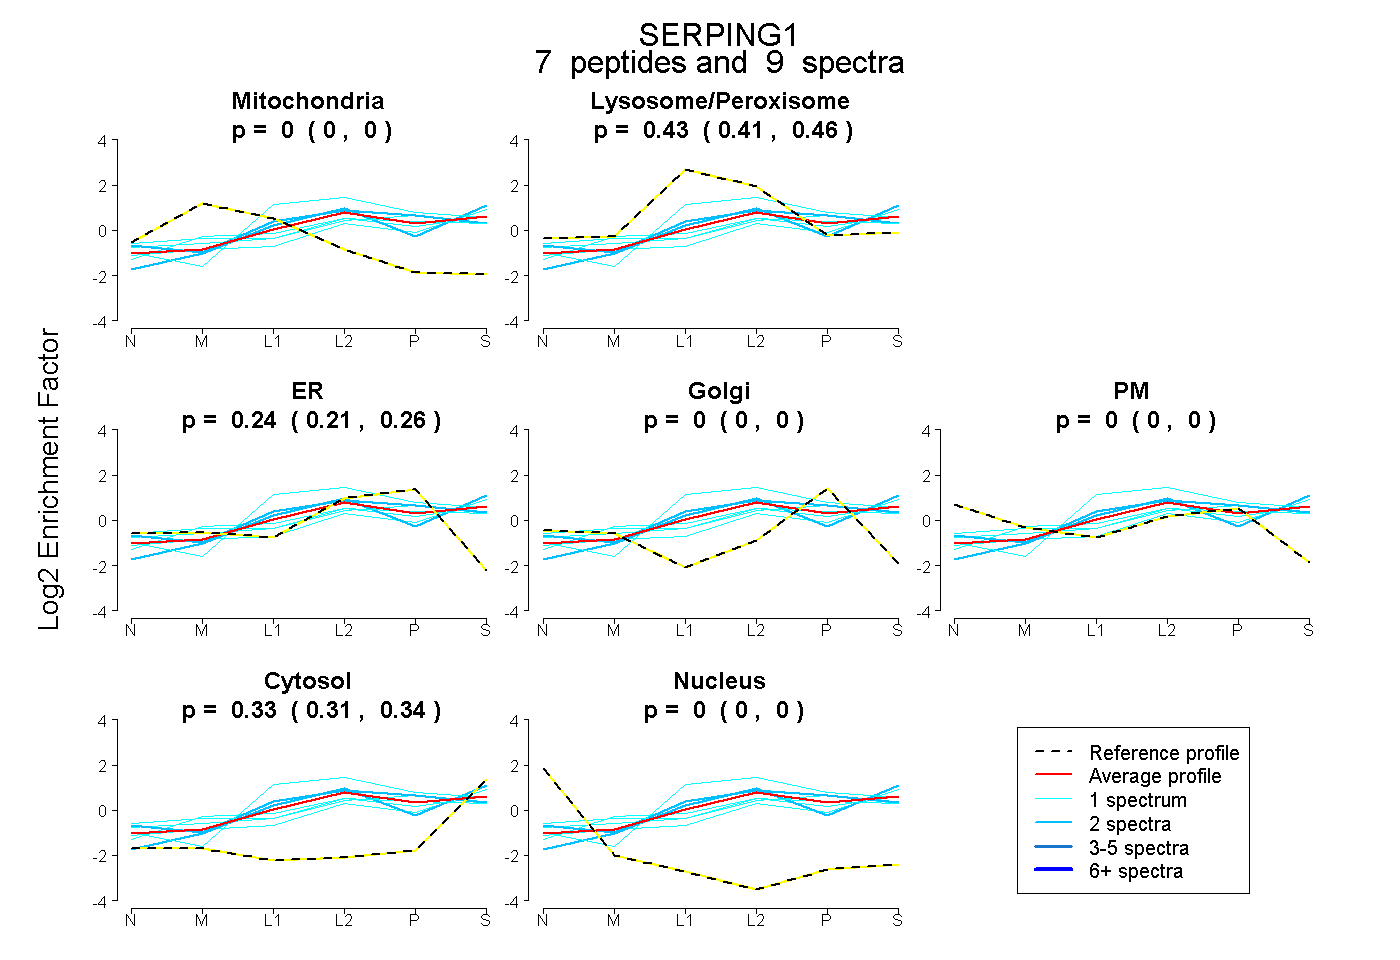
0.000 | 0.000
0.407 | 0.460
0.211 | 0.262
0.000 | 0.000
0.000 | 0.000
0.308 | 0.340
0.000 | 0.000
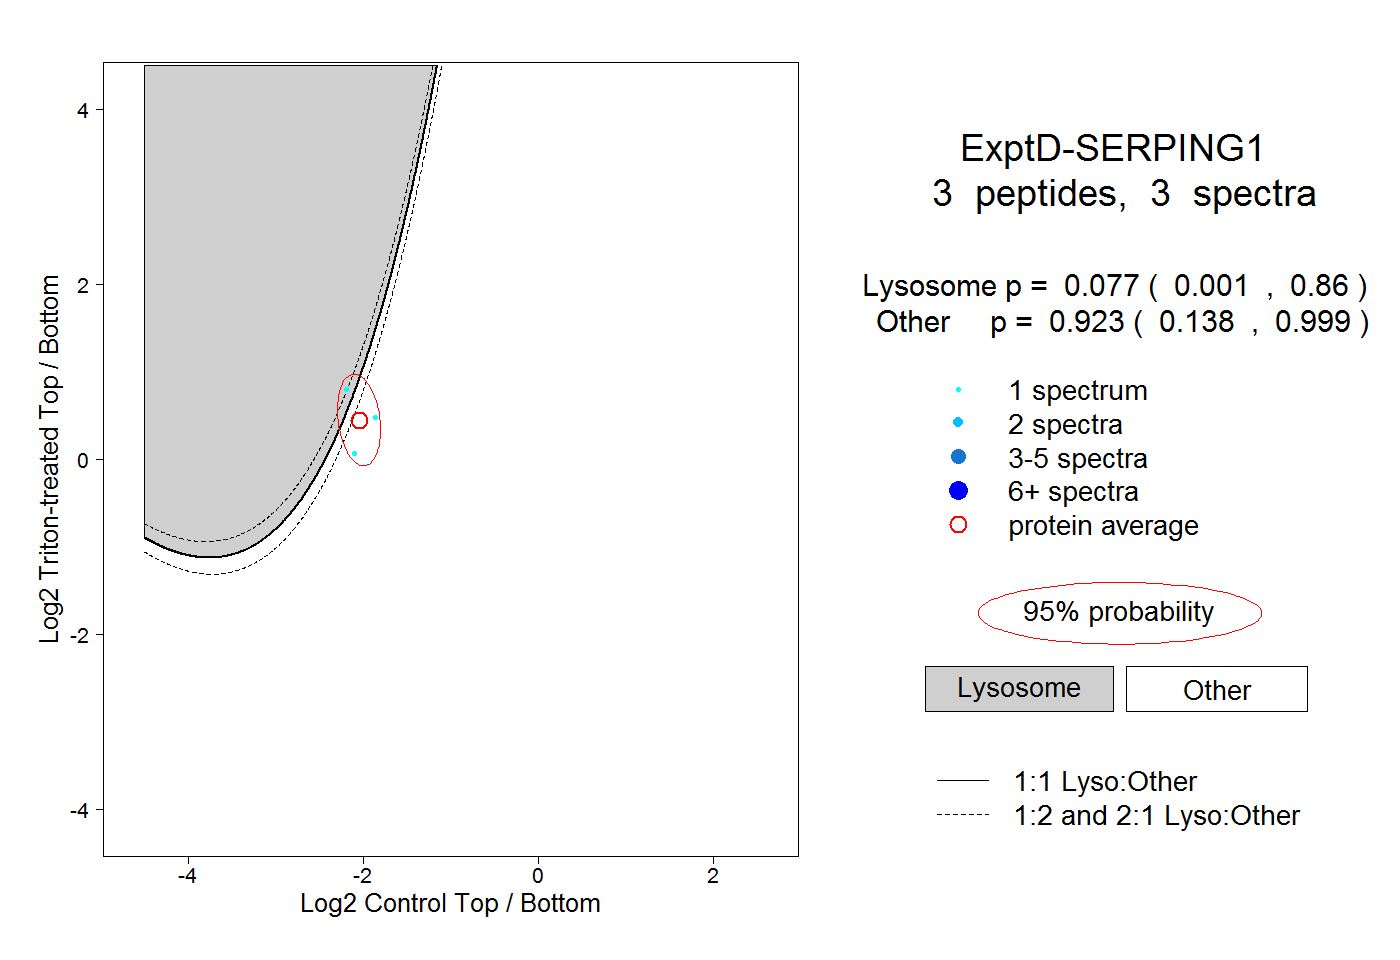
14peptides
spectra
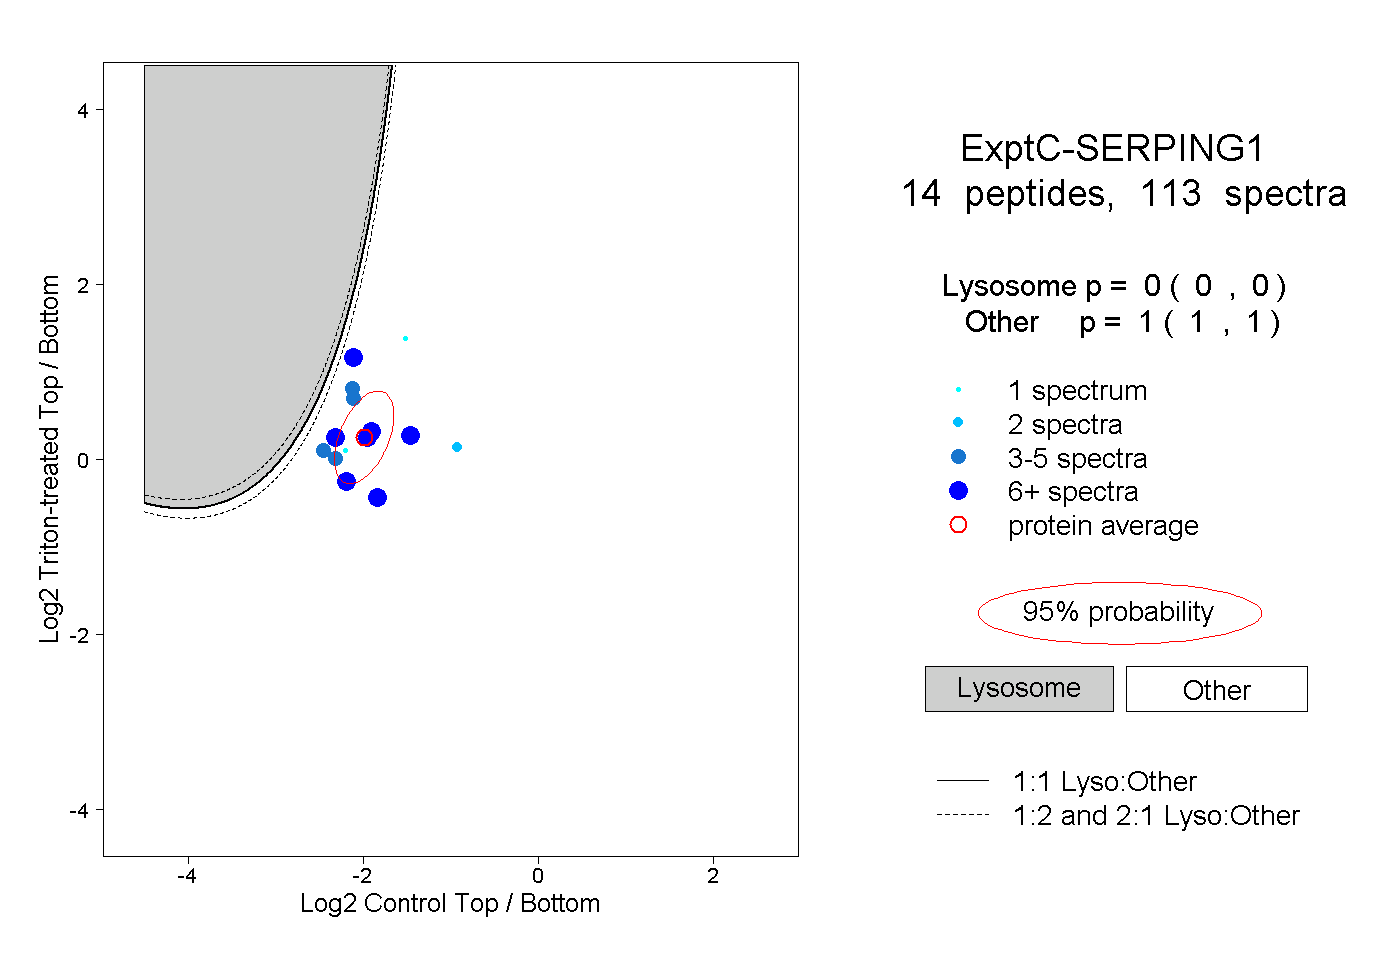
0.000 | 0.000
1.000 | 1.000