SERPING1
[ENSRNOP00000009817]
Main page
| | | Plot |
Mito |
Lyso |
|
Perox |
ER |
Golgi |
PM |
Cytosol |
Nucleus |
|
| Expt A |
 14
14
peptides |
41
spectra |
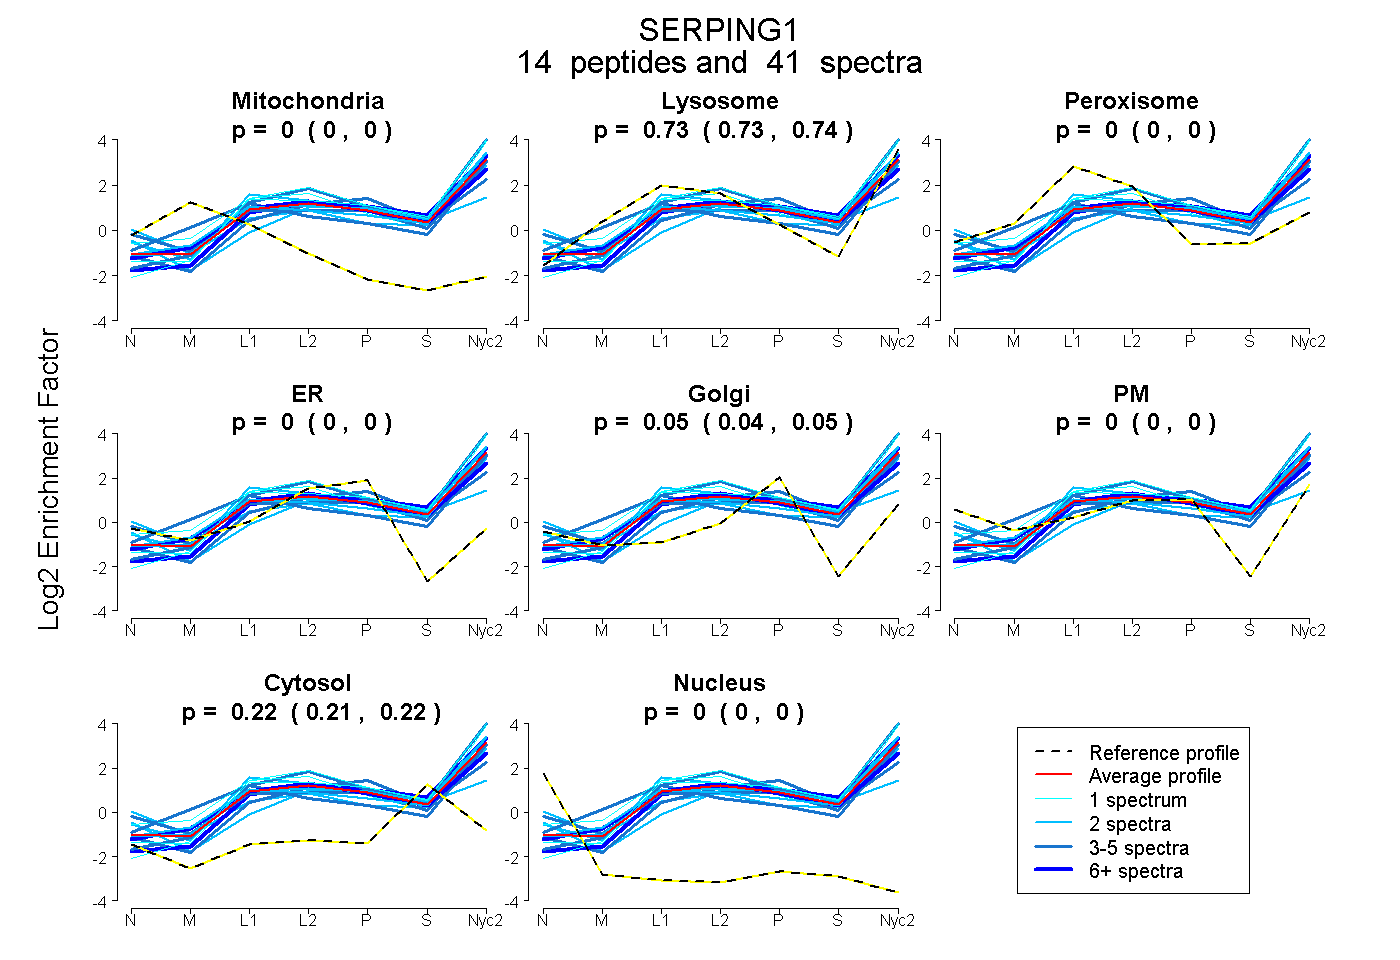 |
0.000
0.000 | 0.000 |
0.734
0.726 | 0.741 |
|
0.000
0.000 | 0.000 |
0.000
0.000 | 0.000 |
0.048
0.041 | 0.054 |
0.000
0.000 | 0.000 |
0.218
0.212 | 0.222 |
0.000
0.000 | 0.000 |
|
| | | Plot |
Mito |
|
Lyso or Perox |
|
ER |
Golgi |
PM |
Cytosol |
Nucleus |
|
| Expt B |
7
peptides |
9
spectra |
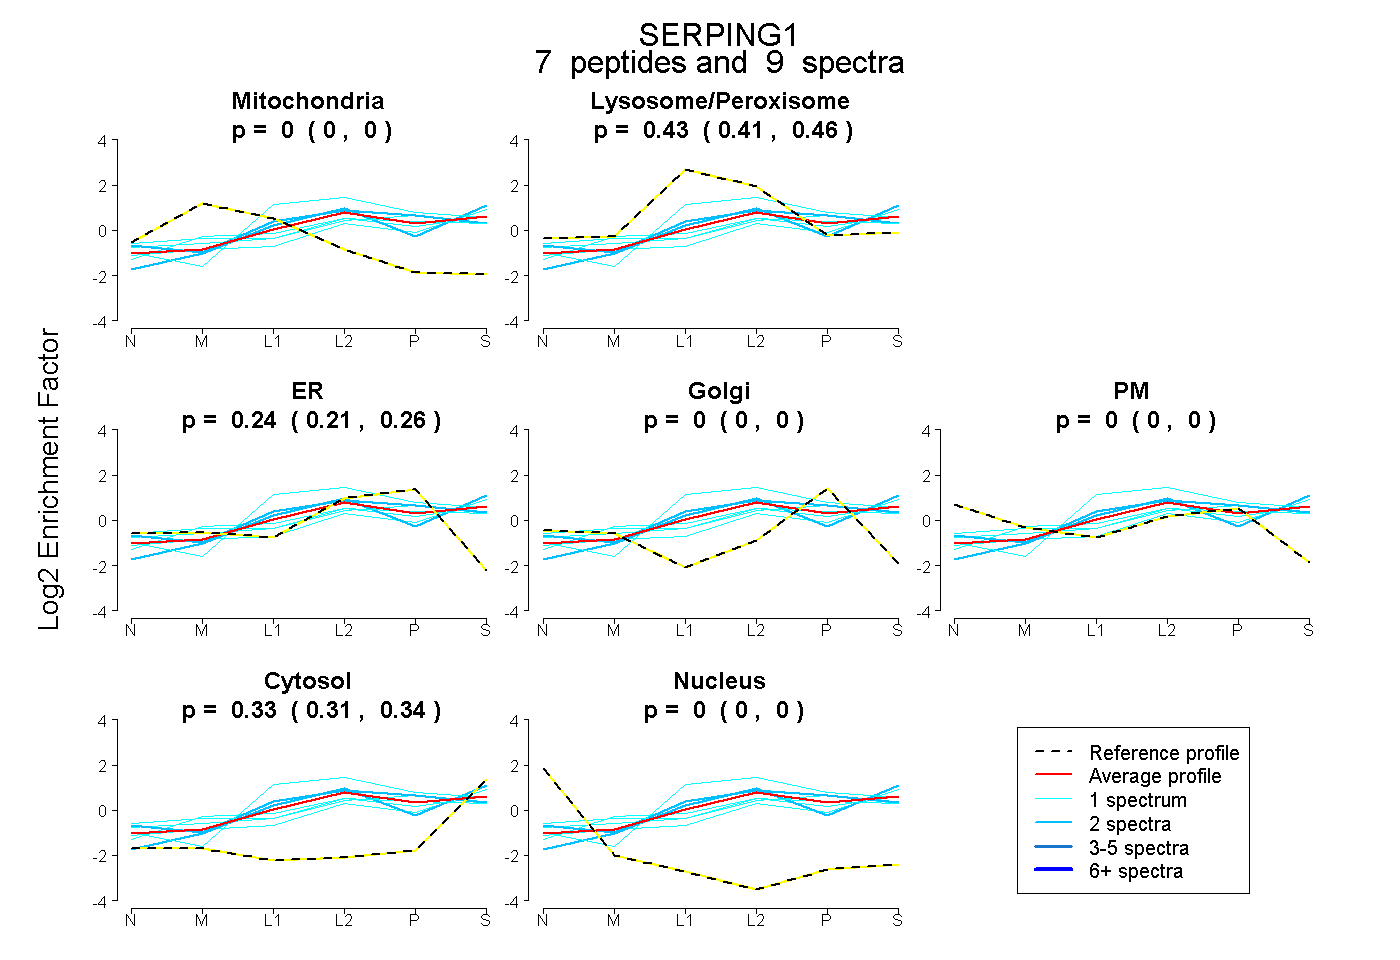 |
0.000
0.000 | 0.000 |
|
0.435
0.407 | 0.460 |
|
0.239
0.211 | 0.262 |
0.000
0.000 | 0.000 |
0.000
0.000 | 0.000 |
0.326
0.308 | 0.340 |
0.000
0.000 | 0.000 |
|
| 2 spectra, LYHAFSATK |
0.000 |
|
0.545 |
|
0.041 |
0.000 |
0.000 |
0.414 |
0.000 |
|
| 2 spectra, INELLDSLPSDTR |
0.000 |
|
0.494 |
|
0.213 |
0.080 |
0.000 |
0.213 |
0.000 |
|
| 1 spectrum, FPVFMGR |
0.000 |
|
0.398 |
|
0.236 |
0.000 |
0.000 |
0.366 |
0.000 |
|
| 1 spectrum, VLGPDGDANLK |
0.000 |
|
0.634 |
|
0.185 |
0.000 |
0.000 |
0.181 |
0.000 |
|
| 1 spectrum, SNLEDILSYPK |
0.000 |
|
0.434 |
|
0.043 |
0.294 |
0.000 |
0.229 |
0.000 |
|
| 1 spectrum, FQPTYVMMPR |
0.000 |
|
0.321 |
|
0.202 |
0.000 |
0.000 |
0.477 |
0.000 |
|
| 1 spectrum, DSVPER |
0.000 |
|
0.389 |
|
0.103 |
0.267 |
0.000 |
0.241 |
0.000 |
|
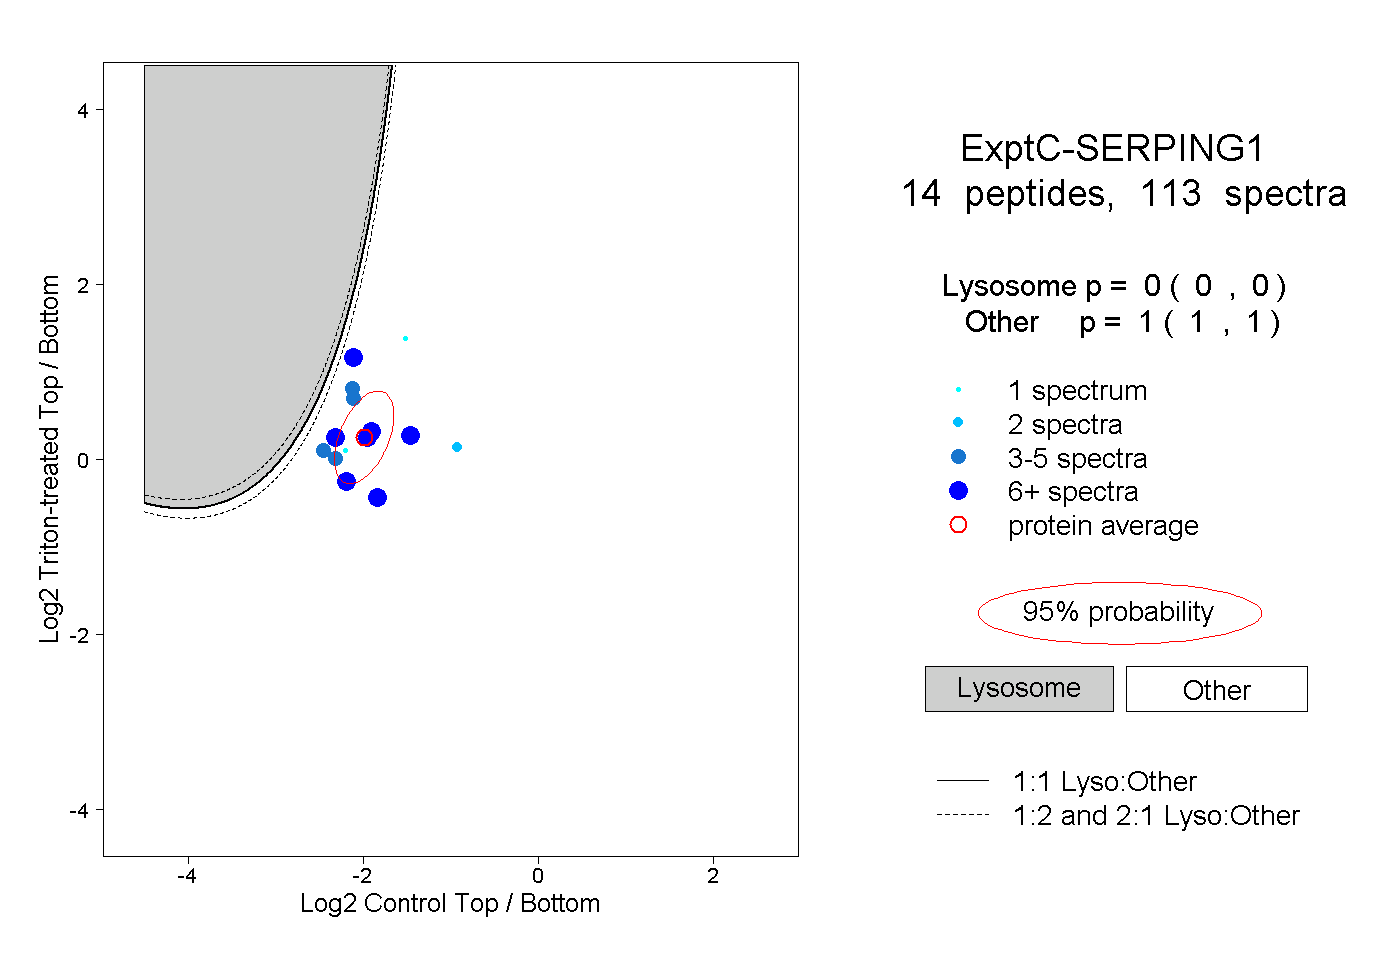
| | | Plot |
|
Lyso |
|
|
|
|
|
|
|
Other |
| Expt C |
14
peptides |
113
spectra |
 |
|
0.000
0.000 | 0.000 |
|
|
|
|
|
|
|
1.000
1.000 | 1.000 |
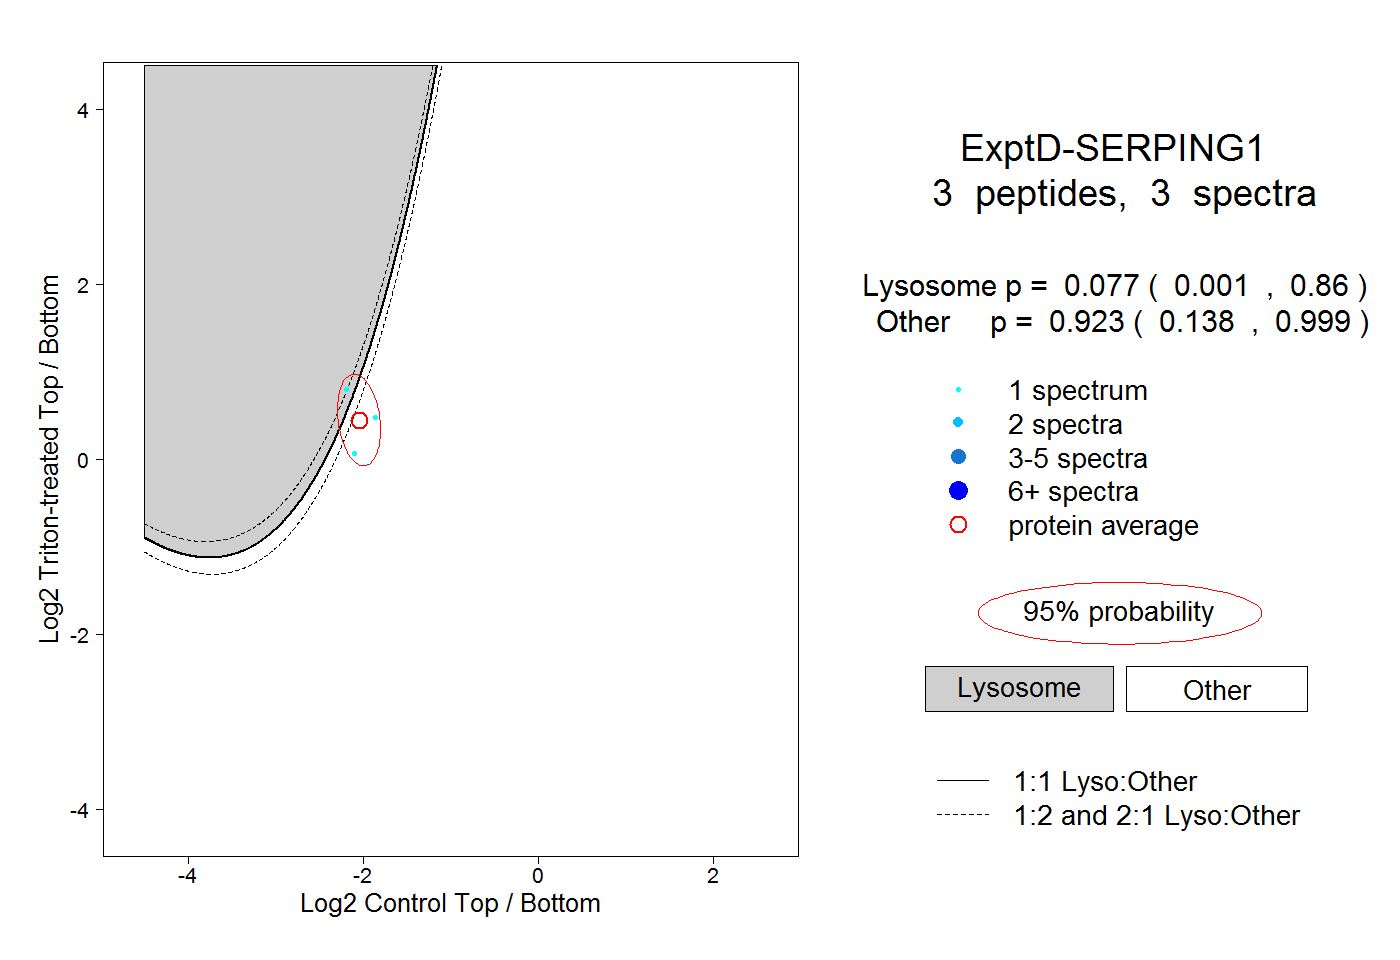
| | | Plot |
|
Lyso |
|
|
|
|
|
|
|
Other |
| Expt D |
3
peptides |
3
spectra |
 |
|
0.077
0.001 | 0.860 |
|
|
|
|
|
|
|
0.923
0.138 | 0.999 |