 14
14peptides
spectra
0.000 | 0.000
0.726 | 0.741
0.000 | 0.000
0.000 | 0.000
0.041 | 0.054
0.000 | 0.000
0.212 | 0.222
0.000 | 0.000
| Plot | Mito | Lyso | Perox | ER | Golgi | PM | Cytosol | Nucleus | |||||
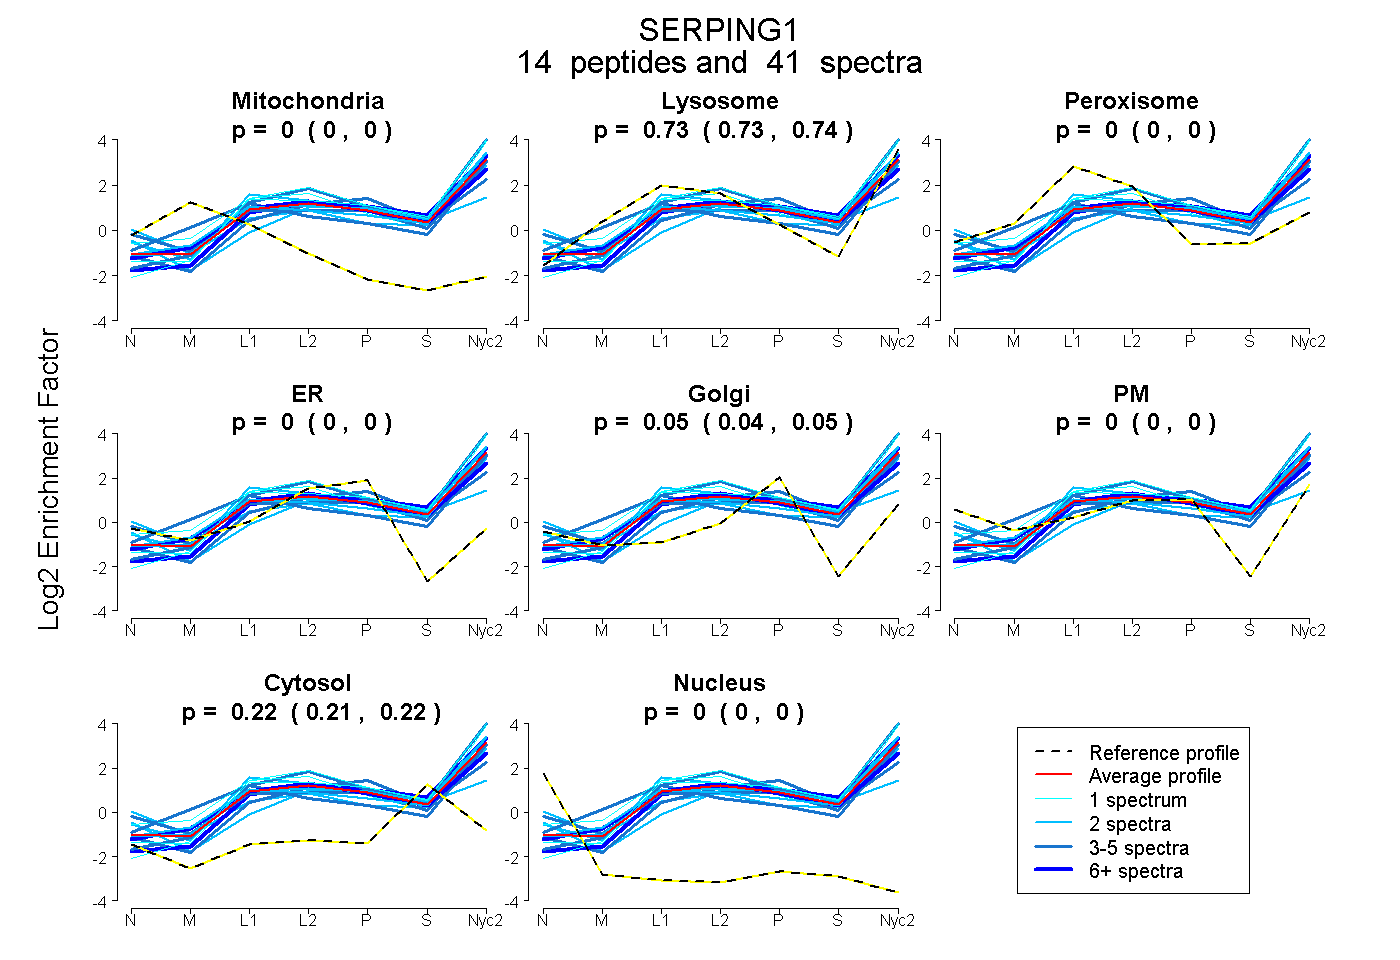
| Expt A |
14 peptides |
41 spectra |
|
0.000 0.000 | 0.000 |
0.734 0.726 | 0.741 |
0.000 0.000 | 0.000 |
0.000 0.000 | 0.000 |
0.048 0.041 | 0.054 |
0.000 0.000 | 0.000 |
0.218 0.212 | 0.222 |
0.000 0.000 | 0.000 |
| 1 spectrum, VPMLSSK | 0.000 | 0.841 | 0.000 | 0.000 | 0.000 | 0.000 | 0.159 | 0.000 | ||
| 1 spectrum, VLGPDGDANLK | 0.000 | 0.877 | 0.000 | 0.000 | 0.000 | 0.000 | 0.123 | 0.000 | ||
| 2 spectra, SNLEDILSYPK | 0.000 | 0.787 | 0.000 | 0.000 | 0.000 | 0.000 | 0.213 | 0.000 | ||
| 6 spectra, FQPTYVMMPR | 0.000 | 0.734 | 0.000 | 0.000 | 0.000 | 0.000 | 0.266 | 0.000 | ||
| 2 spectra, SSQDMLSIMEK | 0.000 | 0.768 | 0.000 | 0.000 | 0.013 | 0.000 | 0.218 | 0.000 | ||
| 5 spectra, FPVFMGR | 0.000 | 0.518 | 0.000 | 0.000 | 0.214 | 0.000 | 0.268 | 0.000 | ||
| 6 spectra, MMASFLYK | 0.000 | 0.722 | 0.000 | 0.000 | 0.046 | 0.000 | 0.232 | 0.000 | ||
| 1 spectrum, LINTWVAENTNHK | 0.000 | 0.879 | 0.000 | 0.000 | 0.000 | 0.048 | 0.073 | 0.000 | ||
| 3 spectra, GVTSVSQIFHSPDLAIR | 0.000 | 0.766 | 0.000 | 0.000 | 0.000 | 0.055 | 0.179 | 0.000 | ||
| 4 spectra, INELLDSLPSDTR | 0.000 | 0.872 | 0.000 | 0.000 | 0.000 | 0.000 | 0.128 | 0.000 | ||
| 4 spectra, LYHAFSATK | 0.000 | 0.569 | 0.000 | 0.000 | 0.000 | 0.242 | 0.189 | 0.000 | ||
| 2 spectra, DSSEATLSEALTDFSVK | 0.000 | 0.529 | 0.000 | 0.000 | 0.000 | 0.230 | 0.241 | 0.000 | ||
| 2 spectra, DFACVHQTLK | 0.000 | 0.691 | 0.010 | 0.000 | 0.000 | 0.108 | 0.192 | 0.000 | ||
| 2 spectra, DSVPER | 0.000 | 0.307 | 0.000 | 0.118 | 0.071 | 0.130 | 0.375 | 0.000 |
| Plot | Mito | Lyso or Perox | ER | Golgi | PM | Cytosol | Nucleus | ||||||
| Expt B |
7 peptides |
9 spectra |
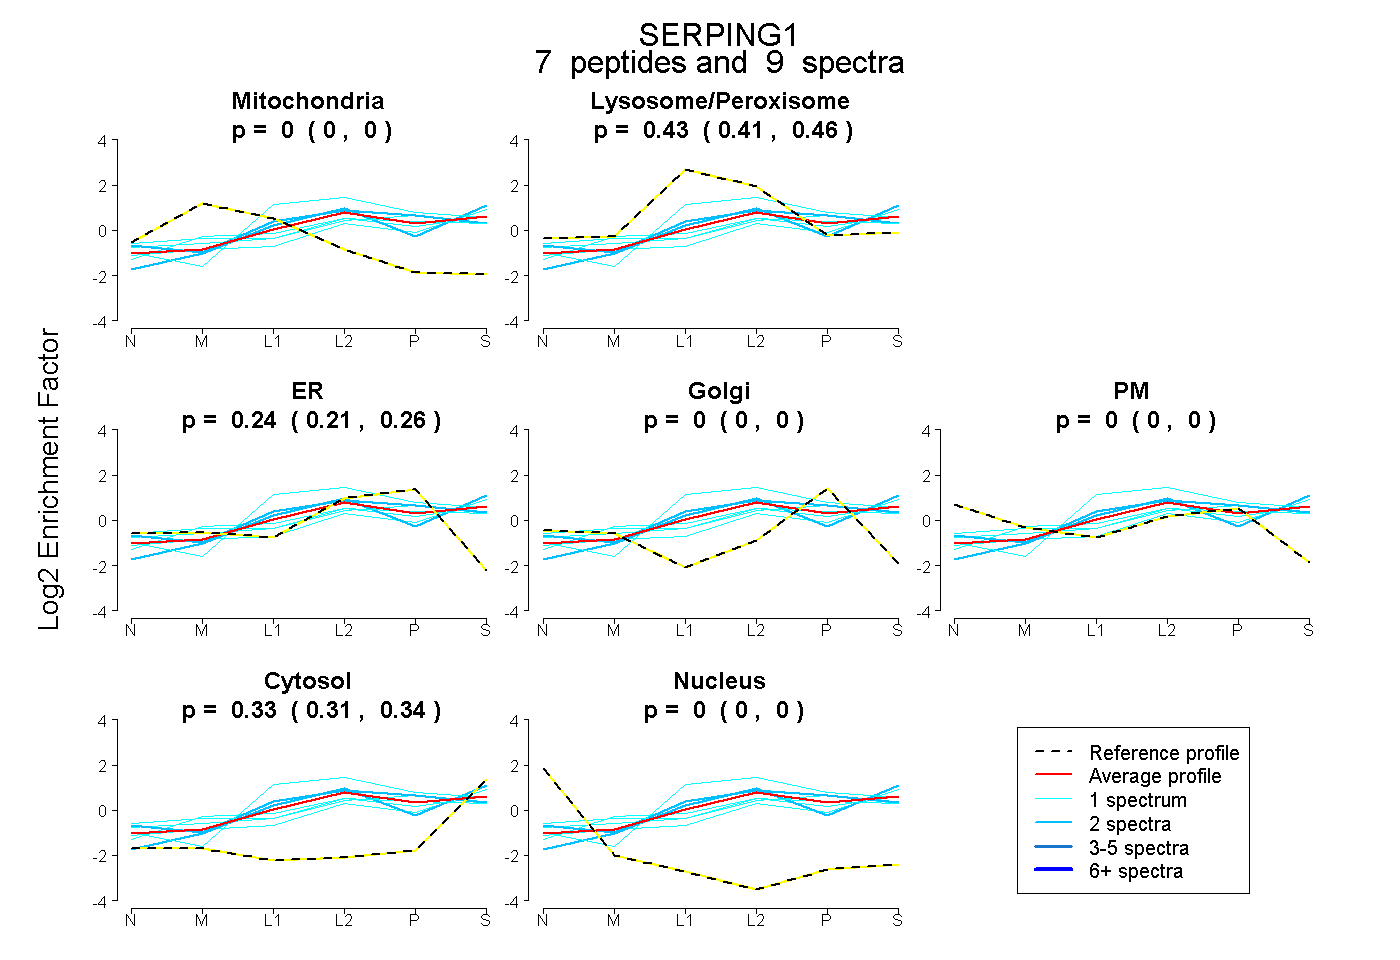 |
0.000 0.000 | 0.000 |
0.435 0.407 | 0.460 |
0.239 0.211 | 0.262 |
0.000 0.000 | 0.000 |
0.000 0.000 | 0.000 |
0.326 0.308 | 0.340 |
0.000 0.000 | 0.000 |
|||
| Plot | Lyso | Other | |||||||||||
| Expt C |
14 peptides |
113 spectra |
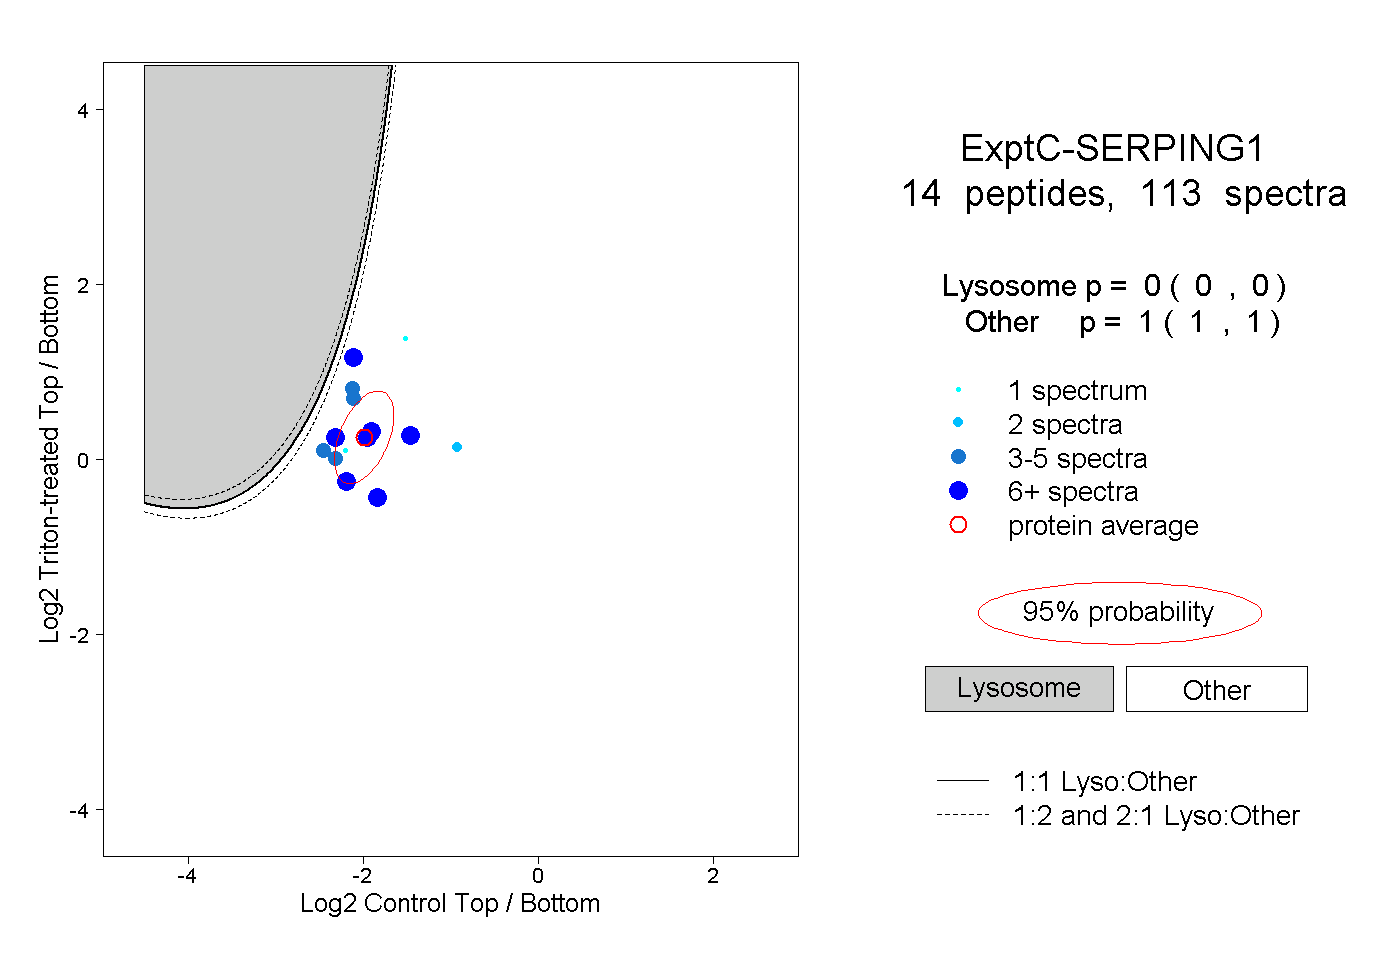 |
0.000 0.000 | 0.000 |
1.000 1.000 | 1.000 |
||||||||
| Plot | Lyso | Other | |||||||||||
| Expt D |
3 peptides |
3 spectra |
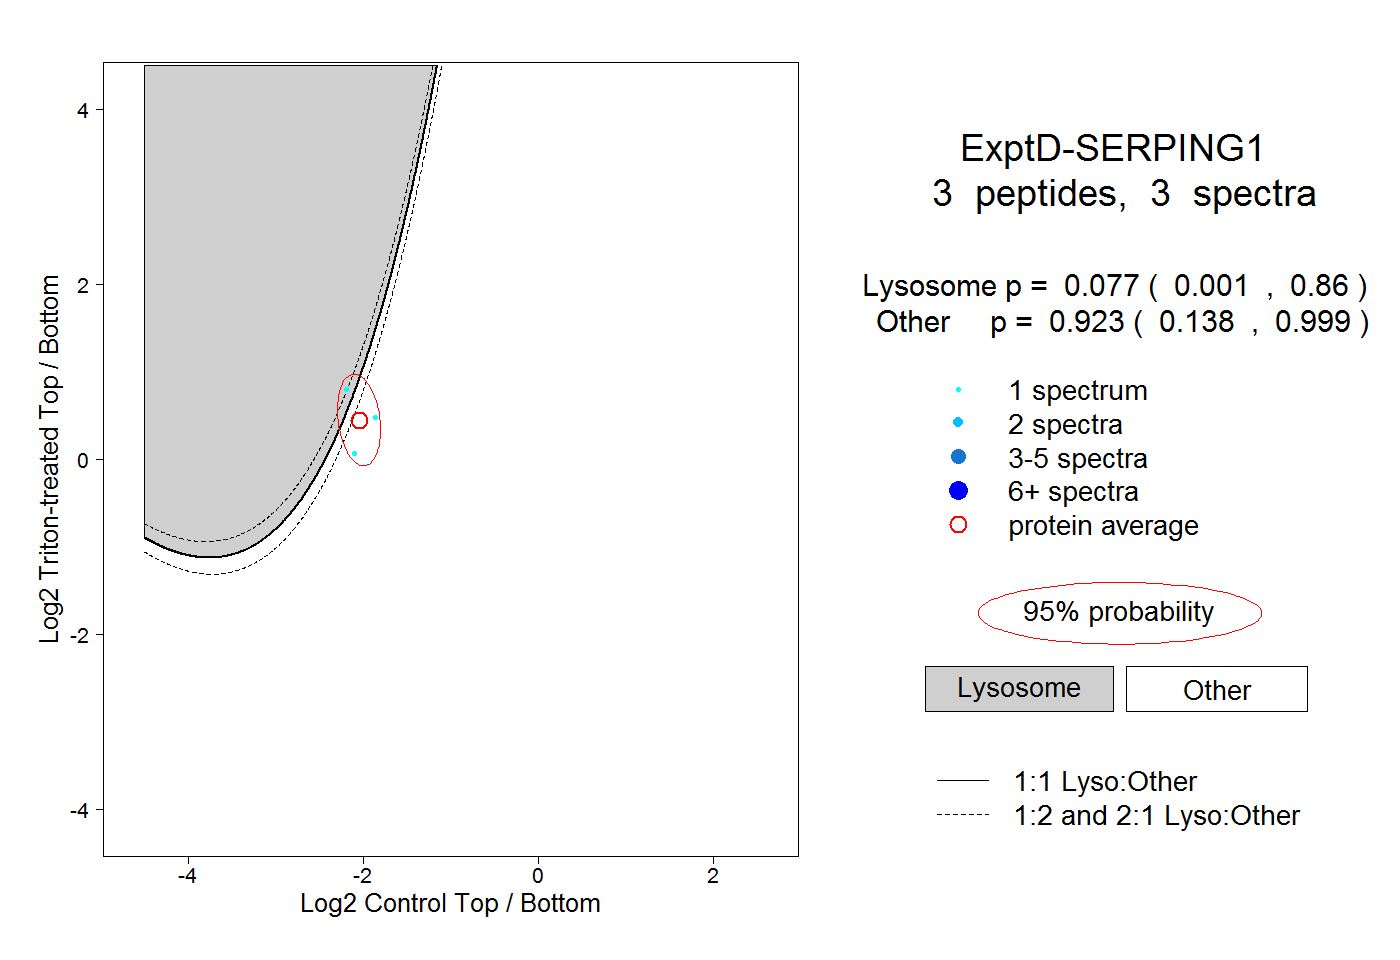 |
0.077 0.001 | 0.860 |
0.923 0.138 | 0.999 |