 3
3peptides
spectra
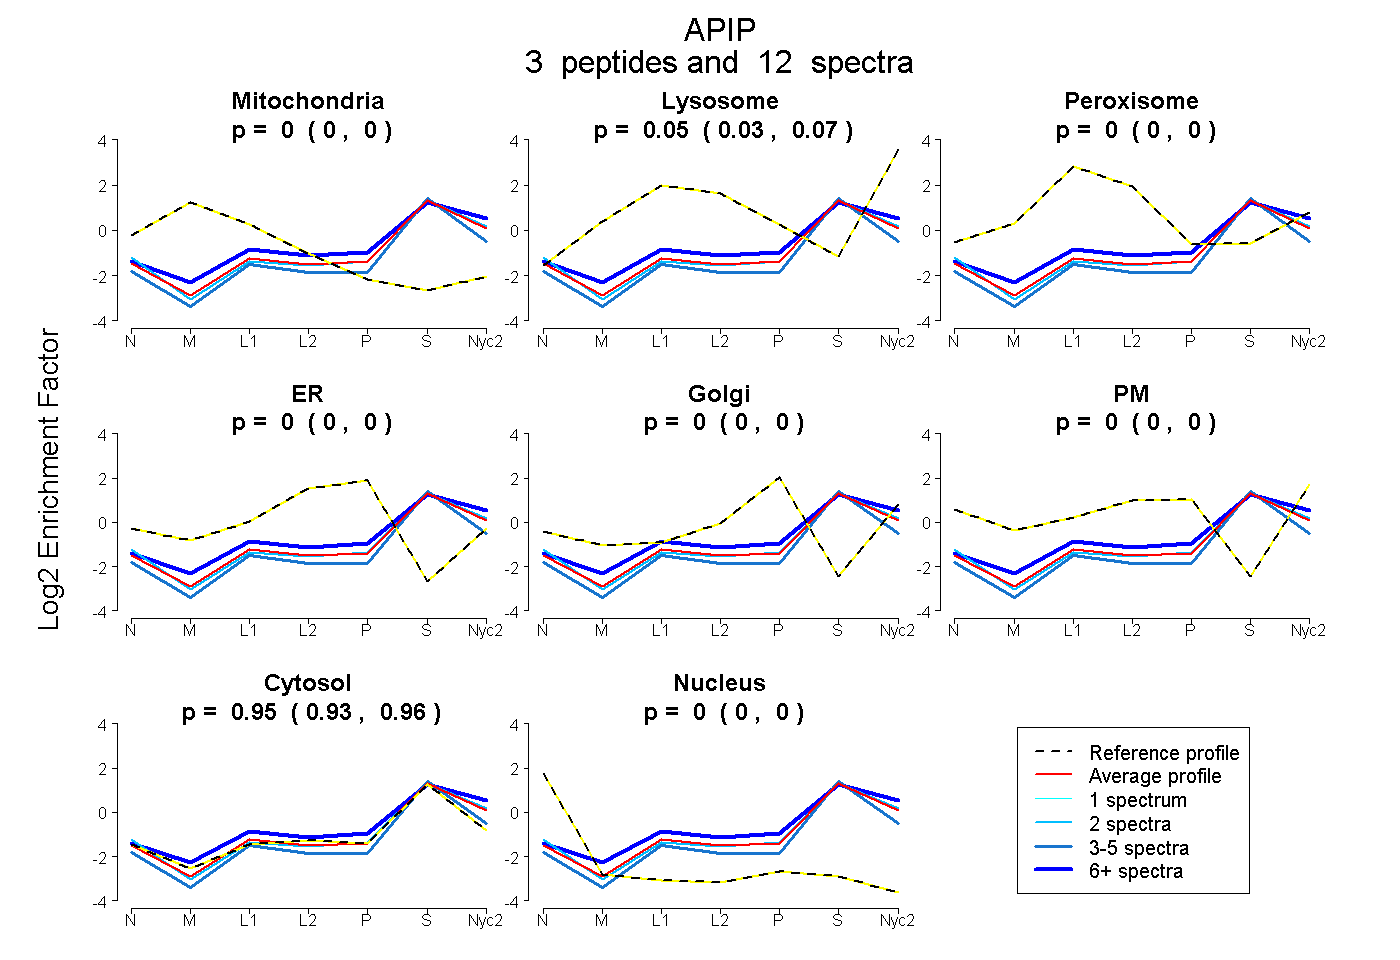
0.000 | 0.000
0.031 | 0.069
0.000 | 0.000
0.000 | 0.000
0.000 | 0.000
0.000 | 0.000
0.928 | 0.965
0.000 | 0.000
| Plot | Mito | Lyso | Perox | ER | Golgi | PM | Cytosol | Nucleus | |||||
| Expt A |
3 peptides |
12 spectra |
|
0.000 0.000 | 0.000 |
0.052 0.031 | 0.069 |
0.000 0.000 | 0.000 |
0.000 0.000 | 0.000 |
0.000 0.000 | 0.000 |
0.000 0.000 | 0.000 |
0.948 0.928 | 0.965 |
0.000 0.000 | 0.000 |
| 3 spectra, MGLDPTQFPVGEHGIV | 0.000 | 0.000 | 0.000 | 0.000 | 0.000 | 0.000 | 1.000 | 0.000 | ||
| 2 spectra, GAGAVIHTHSK | 0.000 | 0.042 | 0.000 | 0.000 | 0.000 | 0.000 | 0.958 | 0.000 | ||
| 7 spectra, CTSGGYYR | 0.000 | 0.175 | 0.000 | 0.000 | 0.000 | 0.000 | 0.825 | 0.000 |