 15
15peptides
spectra
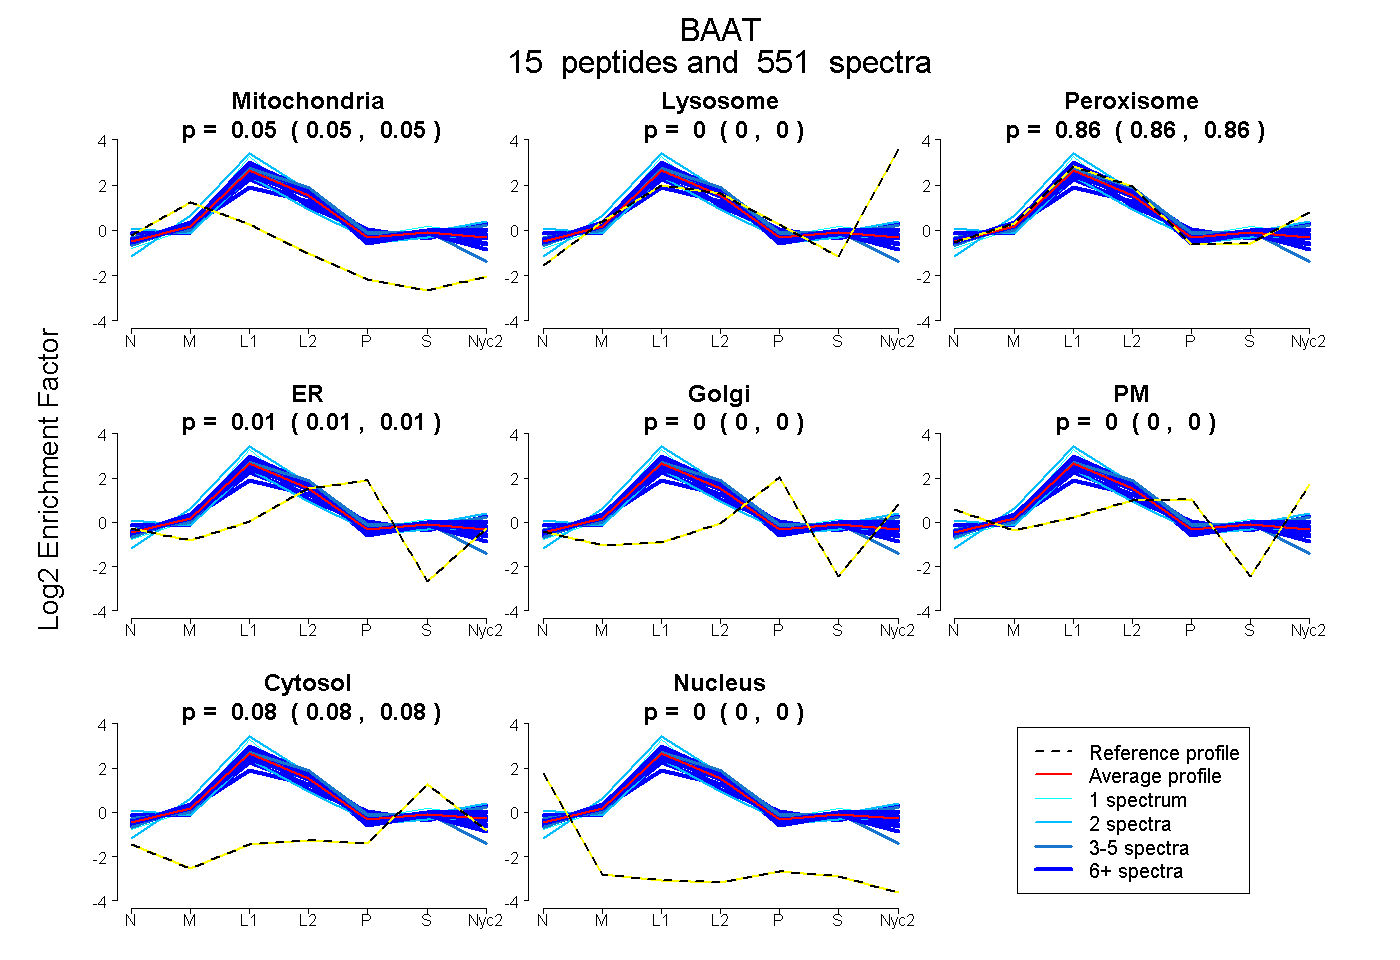
0.045 | 0.047
0.000 | 0.000
0.858 | 0.861
0.012 | 0.014
0.000 | 0.000
0.000 | 0.000
0.081 | 0.082
0.000 | 0.000
16peptides
spectra
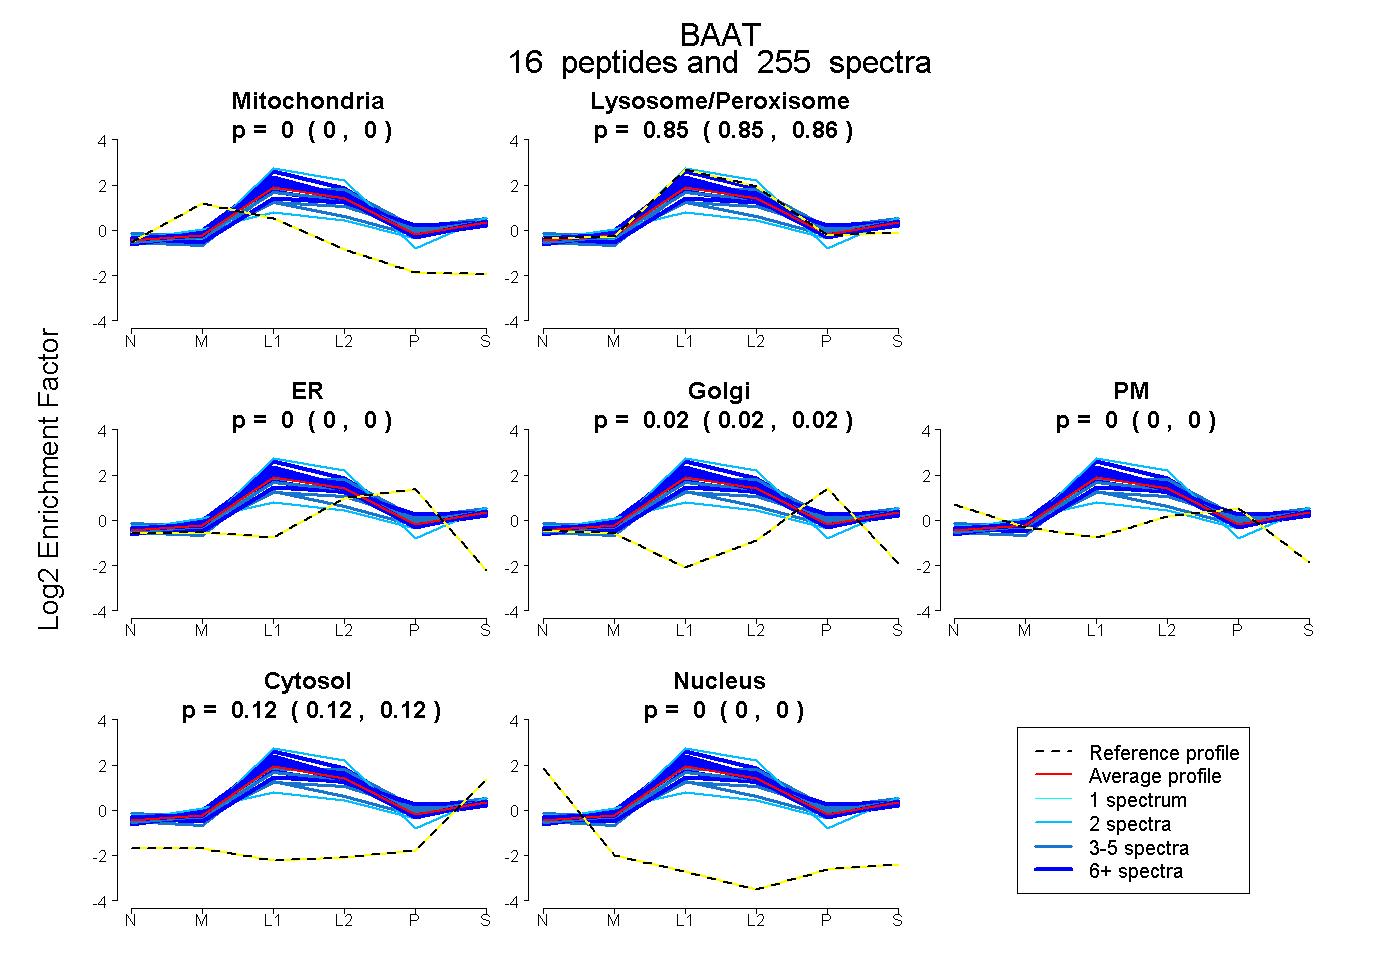
0.000 | 0.000
0.852 | 0.857
0.000 | 0.000
0.021 | 0.024
0.000 | 0.000
0.121 | 0.124
0.000 | 0.000
18peptides
spectra
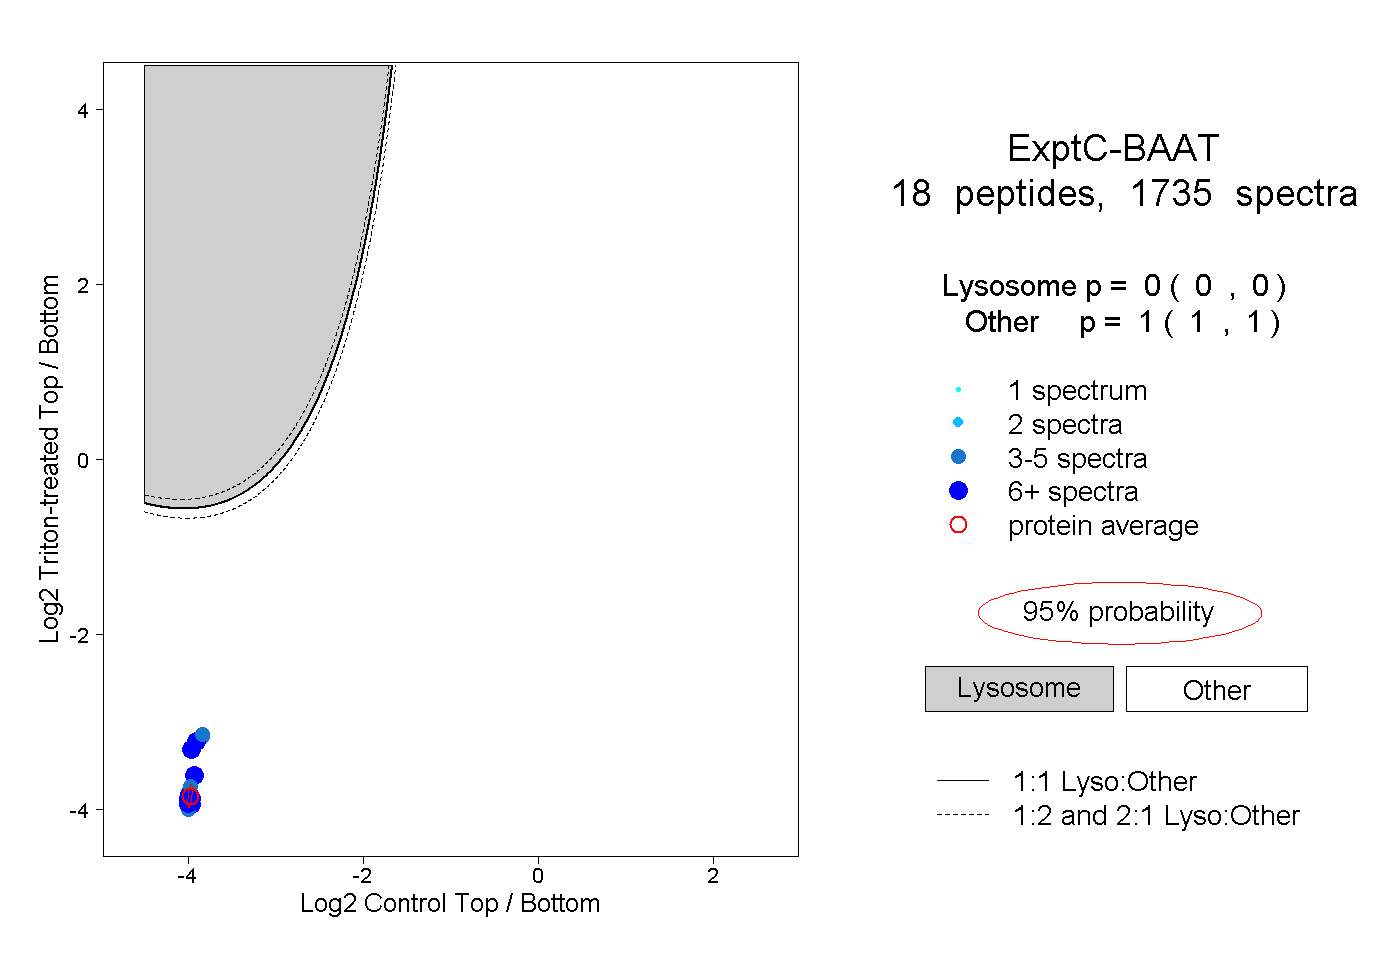
0.000 | 0.000
1.000 | 1.000
11peptides
spectra
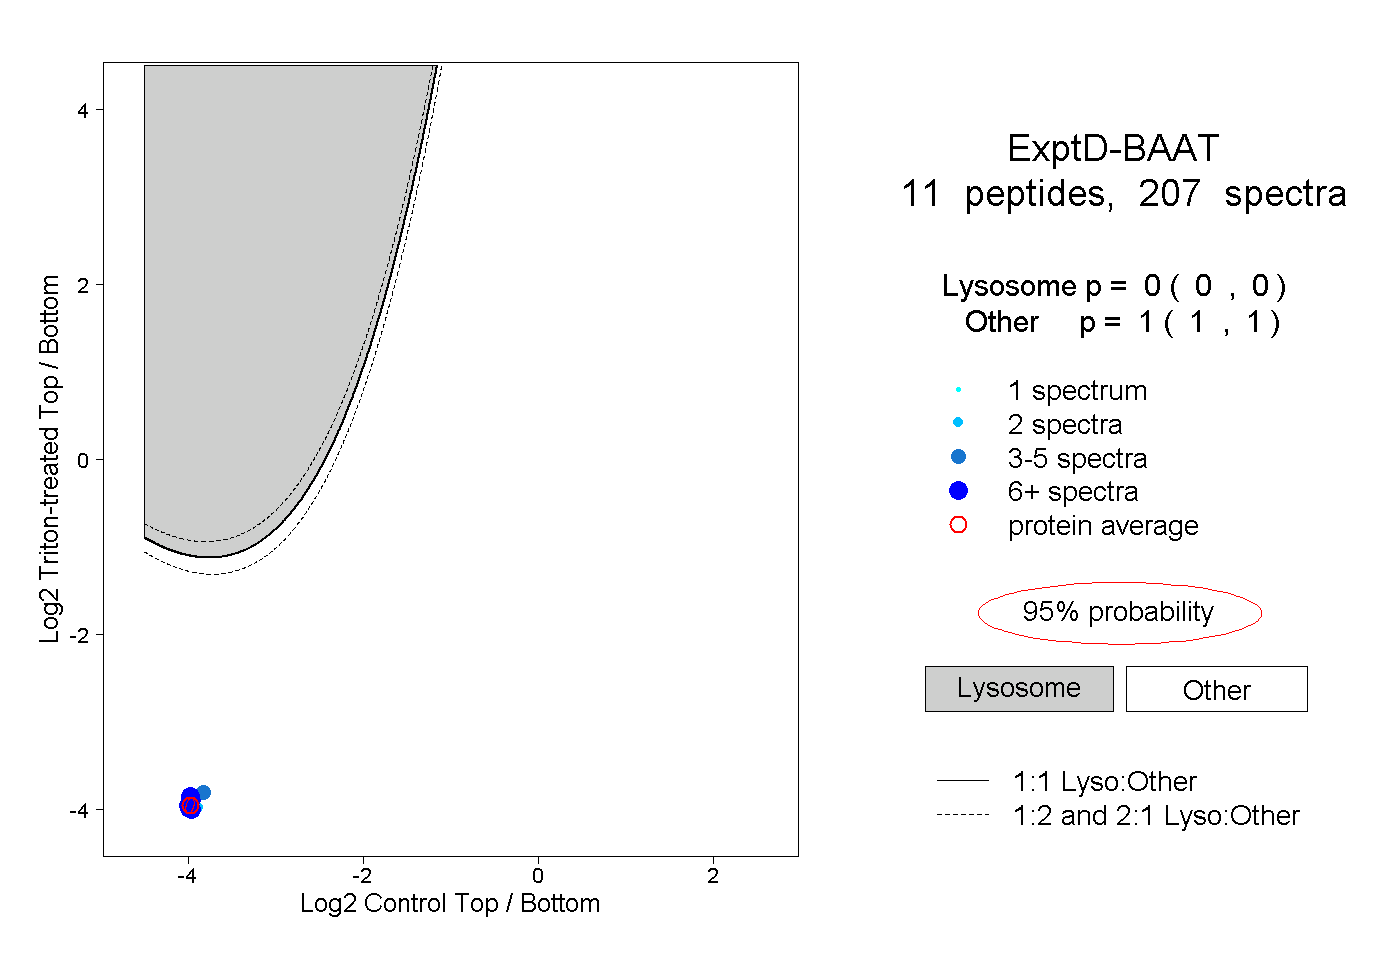
0.000 | 0.000
1.000 | 1.000