 2
2peptides
spectra
NA | NA
NA | NA
NA | NA
NA | NA
NA | NA
NA | NA
NA | NA
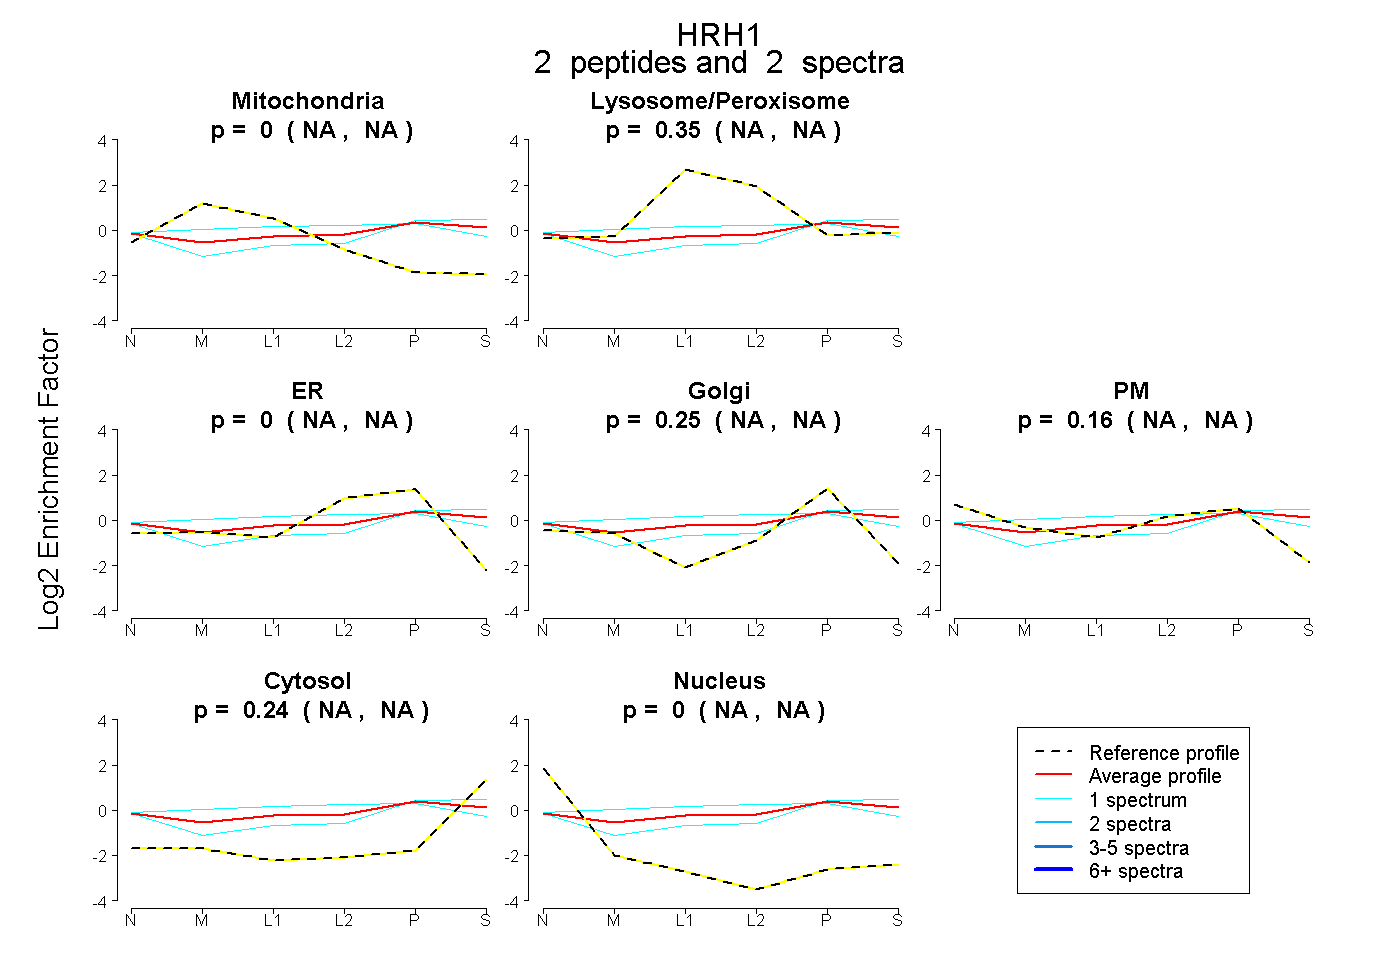
| Plot | Mito | Lyso or Perox | ER | Golgi | PM | Cytosol | Nucleus | ||||||
| Expt B |
2 peptides |
2 spectra |
|
0.000 NA | NA |
0.349 NA | NA |
0.000 NA | NA |
0.249 NA | NA |
0.158 NA | NA |
0.244 NA | NA |
0.000 NA | NA |
| 1 spectrum, ANDQALSQPK | 0.016 | 0.416 | 0.000 | 0.216 | 0.219 | 0.133 | 0.000 | |||
| 1 spectrum, ILHIR | 0.000 | 0.280 | 0.000 | 0.290 | 0.079 | 0.351 | 0.000 |