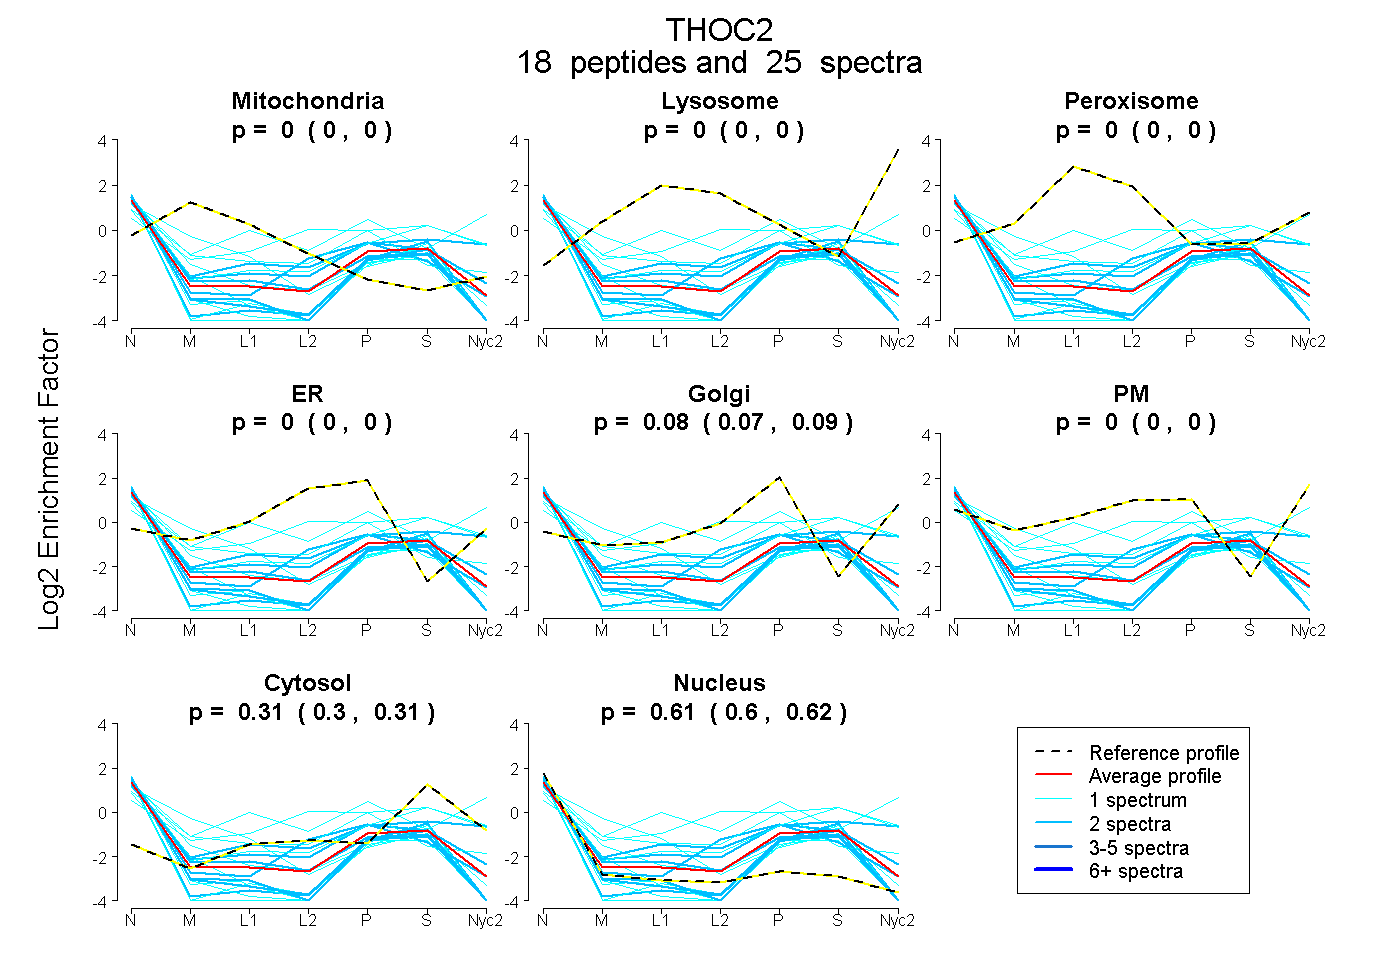
 18
18peptides
spectra
0.000 | 0.000
0.000 | 0.000
0.000 | 0.000
0.000 | 0.000
0.068 | 0.092
0.000 | 0.000
0.296 | 0.314
0.599 | 0.623
| Plot | Mito | Lyso | Perox | ER | Golgi | PM | Cytosol | Nucleus | |||||
| Expt A |
18 peptides |
25 spectra |
|
0.000 0.000 | 0.000 |
0.000 0.000 | 0.000 |
0.000 0.000 | 0.000 |
0.000 0.000 | 0.000 |
0.081 0.068 | 0.092 |
0.000 0.000 | 0.000 |
0.306 0.296 | 0.314 |
0.612 0.599 | 0.623 |
| 1 spectrum, FVELVHQQK | 0.000 | 0.000 | 0.000 | 0.000 | 0.000 | 0.000 | 0.160 | 0.840 | ||
| 1 spectrum, ILPWYPK | 0.000 | 0.000 | 0.000 | 0.000 | 0.000 | 0.000 | 0.203 | 0.797 | ||
| 2 spectra, NILIVLTK | 0.000 | 0.000 | 0.000 | 0.226 | 0.000 | 0.000 | 0.172 | 0.602 | ||
| 2 spectra, ADQLDYENFR | 0.000 | 0.000 | 0.000 | 0.000 | 0.000 | 0.000 | 0.220 | 0.780 | ||
| 2 spectra, TPNFSTLLCYDR | 0.000 | 0.000 | 0.000 | 0.000 | 0.000 | 0.000 | 0.193 | 0.807 | ||
| 2 spectra, VLNLGQALER | 0.000 | 0.000 | 0.000 | 0.000 | 0.000 | 0.000 | 0.171 | 0.829 | ||
| 1 spectrum, TPATTPEAR | 0.050 | 0.000 | 0.081 | 0.102 | 0.277 | 0.000 | 0.052 | 0.438 | ||
| 1 spectrum, FYQEPSGETPSSLYR | 0.000 | 0.000 | 0.000 | 0.000 | 0.000 | 0.000 | 0.159 | 0.841 | ||
| 1 spectrum, GGEKPPVSGSLK | 0.000 | 0.000 | 0.000 | 0.000 | 0.000 | 0.629 | 0.293 | 0.078 | ||
| 1 spectrum, AEGGYFGQIR | 0.132 | 0.000 | 0.000 | 0.000 | 0.000 | 0.000 | 0.192 | 0.676 | ||
| 1 spectrum, FLQLCIFPR | 0.000 | 0.000 | 0.000 | 0.000 | 0.000 | 0.000 | 0.117 | 0.883 | ||
| 1 spectrum, GSPVSALQNK | 0.418 | 0.000 | 0.000 | 0.000 | 0.000 | 0.000 | 0.163 | 0.419 | ||
| 2 spectra, LDPETLESLGLIK | 0.000 | 0.000 | 0.000 | 0.099 | 0.114 | 0.000 | 0.294 | 0.493 | ||
| 2 spectra, SLIGCFNLDPNR | 0.000 | 0.000 | 0.000 | 0.064 | 0.000 | 0.000 | 0.227 | 0.710 | ||
| 1 spectrum, QMEHVQR | 0.000 | 0.000 | 0.073 | 0.165 | 0.000 | 0.208 | 0.470 | 0.085 | ||
| 2 spectra, ICQEEK | 0.000 | 0.000 | 0.000 | 0.000 | 0.000 | 0.303 | 0.396 | 0.301 | ||
| 1 spectrum, EENEGYAK | 0.000 | 0.000 | 0.000 | 0.000 | 0.000 | 0.000 | 0.216 | 0.784 | ||
| 1 spectrum, QSQQFNQK | 0.000 | 0.000 | 0.000 | 0.000 | 0.019 | 0.194 | 0.544 | 0.243 |
| Plot | Lyso | Other | |||||||||||
| Expt C |
1 peptide |
1 spectrum |
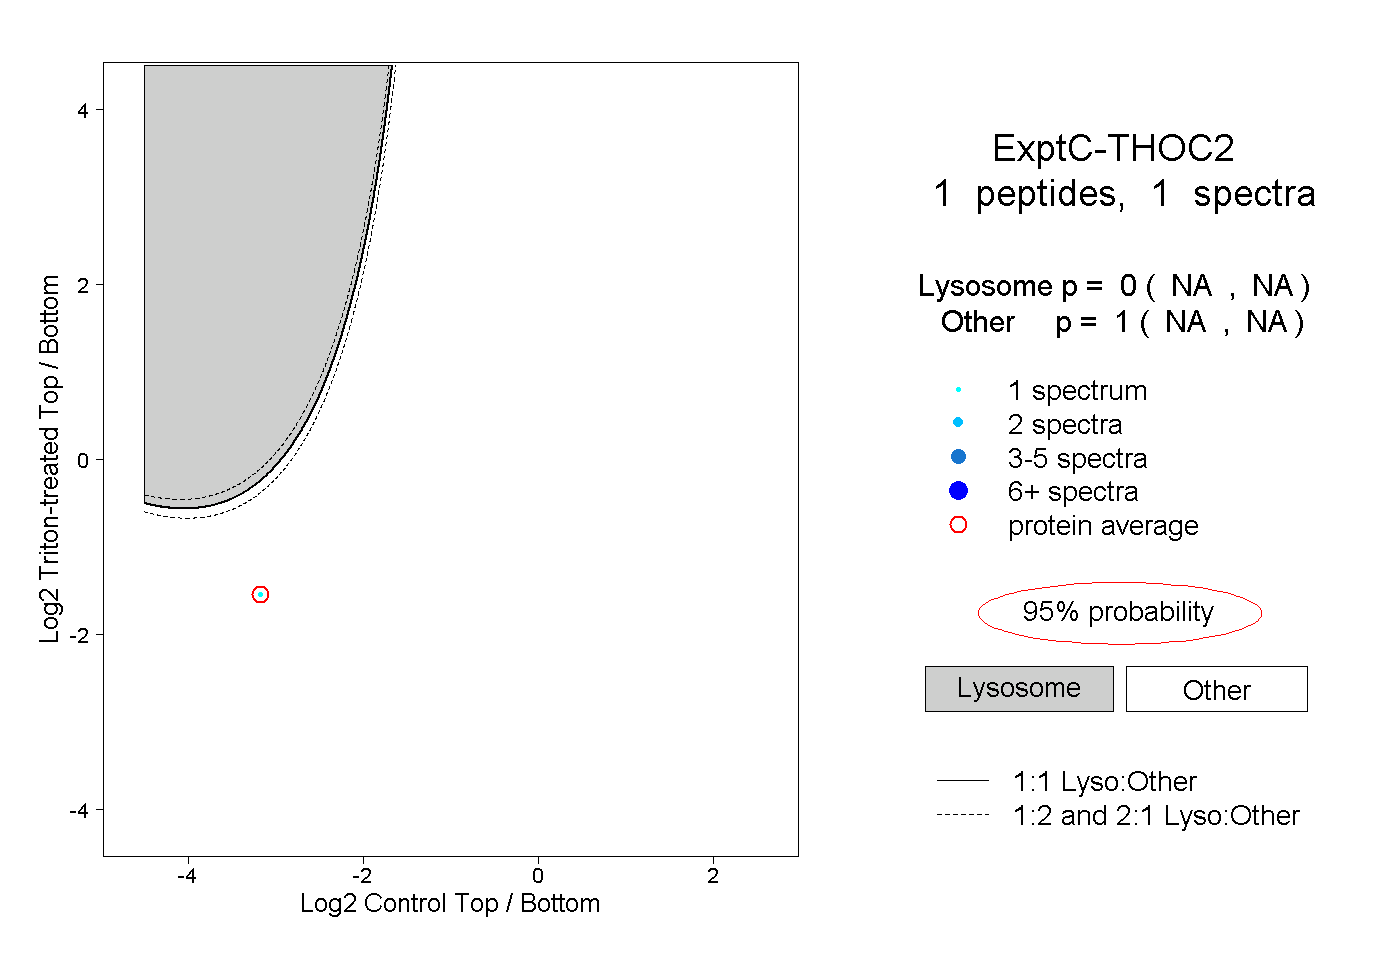 |
0.000 NA | NA |
1.000 NA | NA |
||||||||
| Plot | Lyso | Other | |||||||||||
| Expt D |
1 peptide |
1 spectrum |
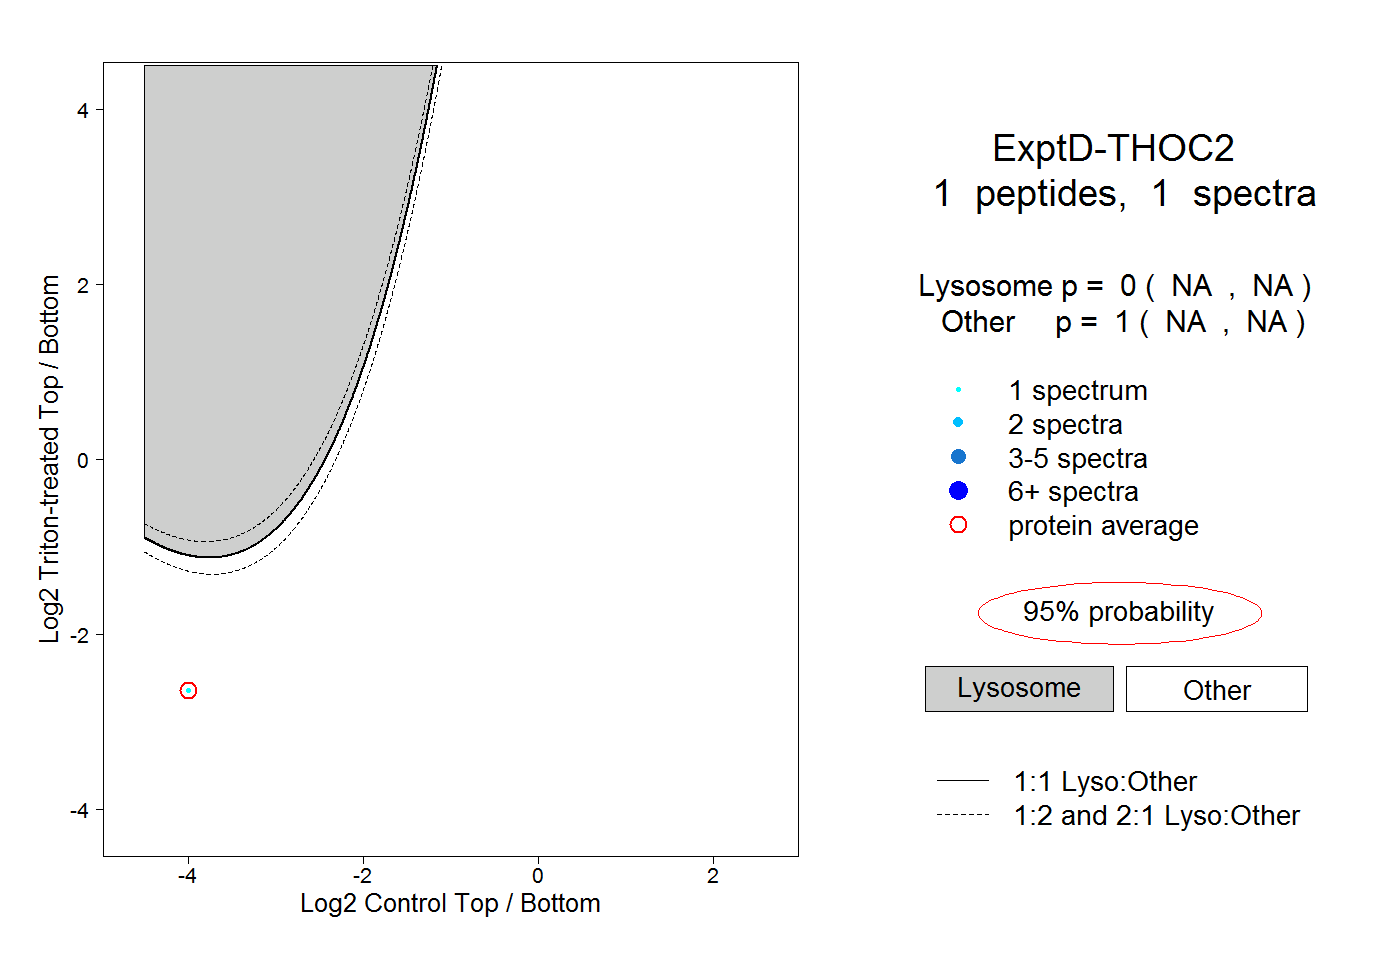 |
0.000 NA | NA |
1.000 NA | NA |