 11
11peptides
spectra
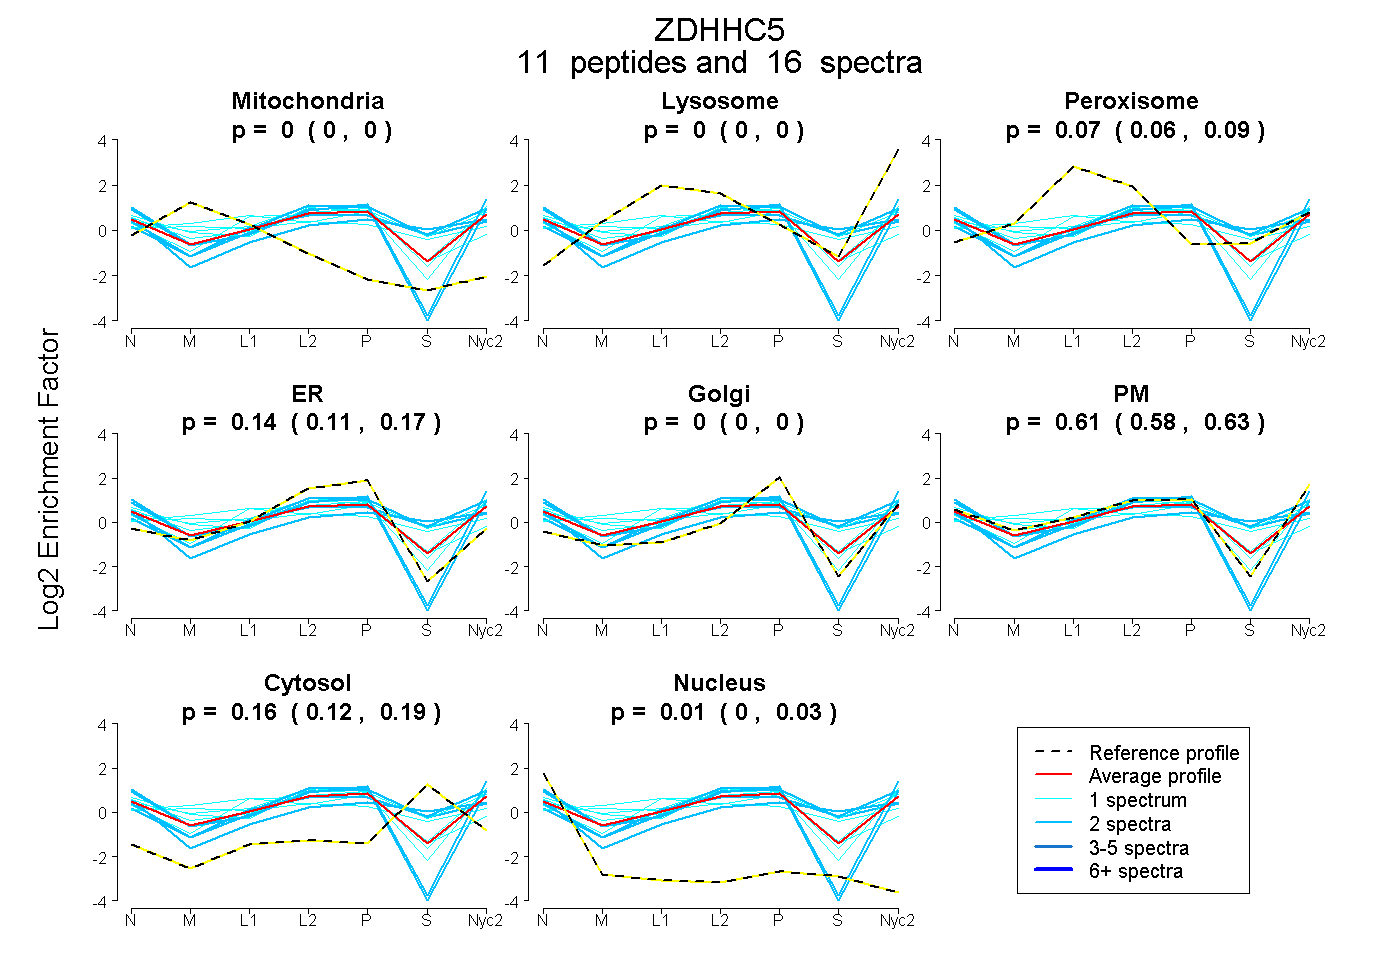
0.000 | 0.000
0.000 | 0.000
0.058 | 0.088
0.114 | 0.167
0.000 | 0.000
0.579 | 0.632
0.124 | 0.188
0.000 | 0.029
14peptides
spectra
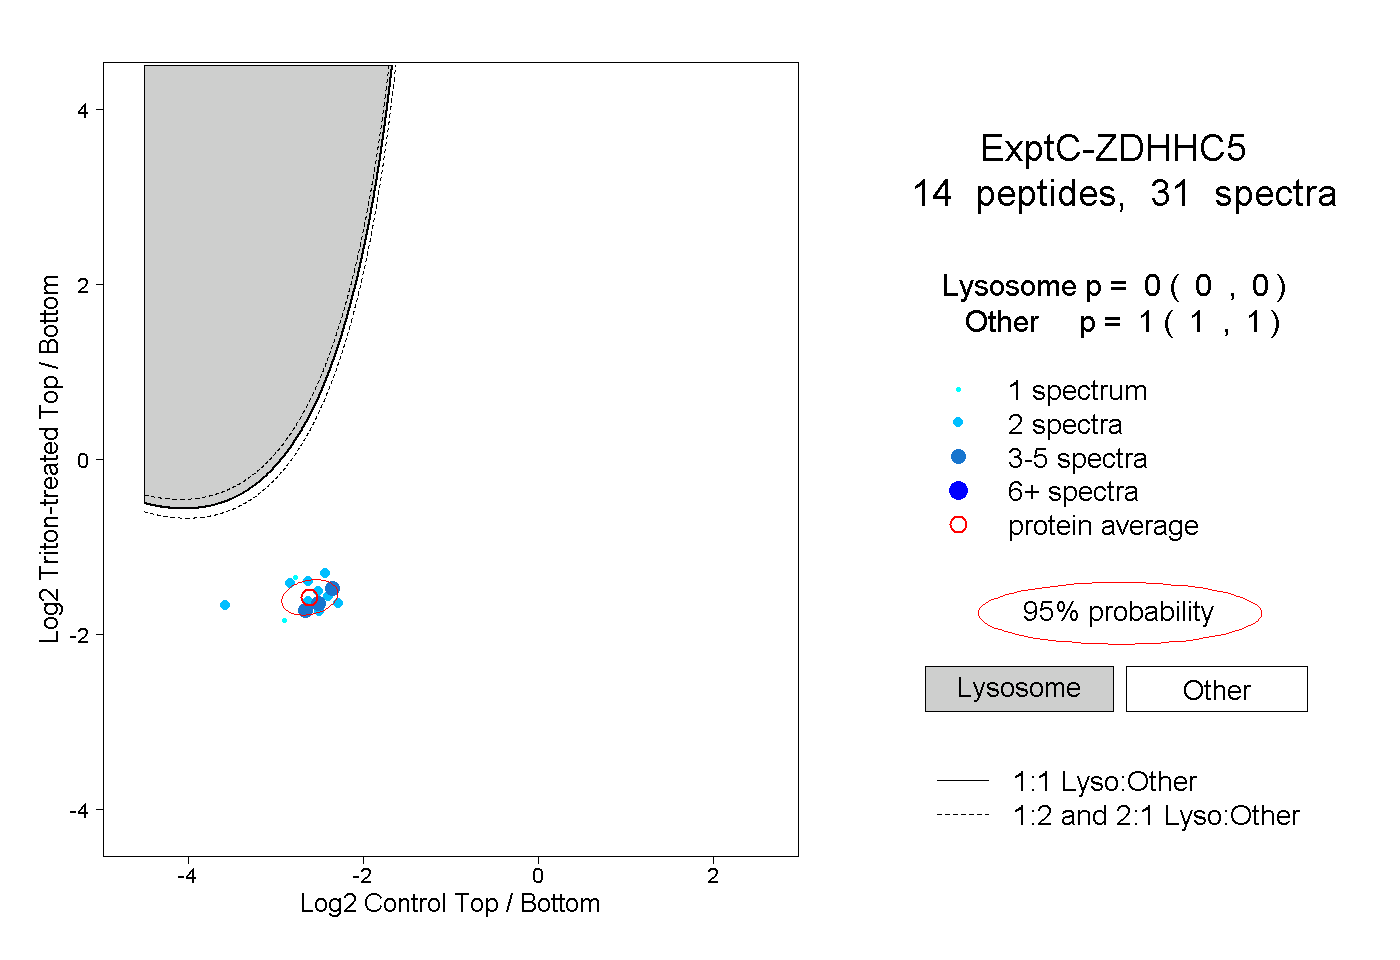
0.000 | 0.000
1.000 | 1.000
1peptide
spectra
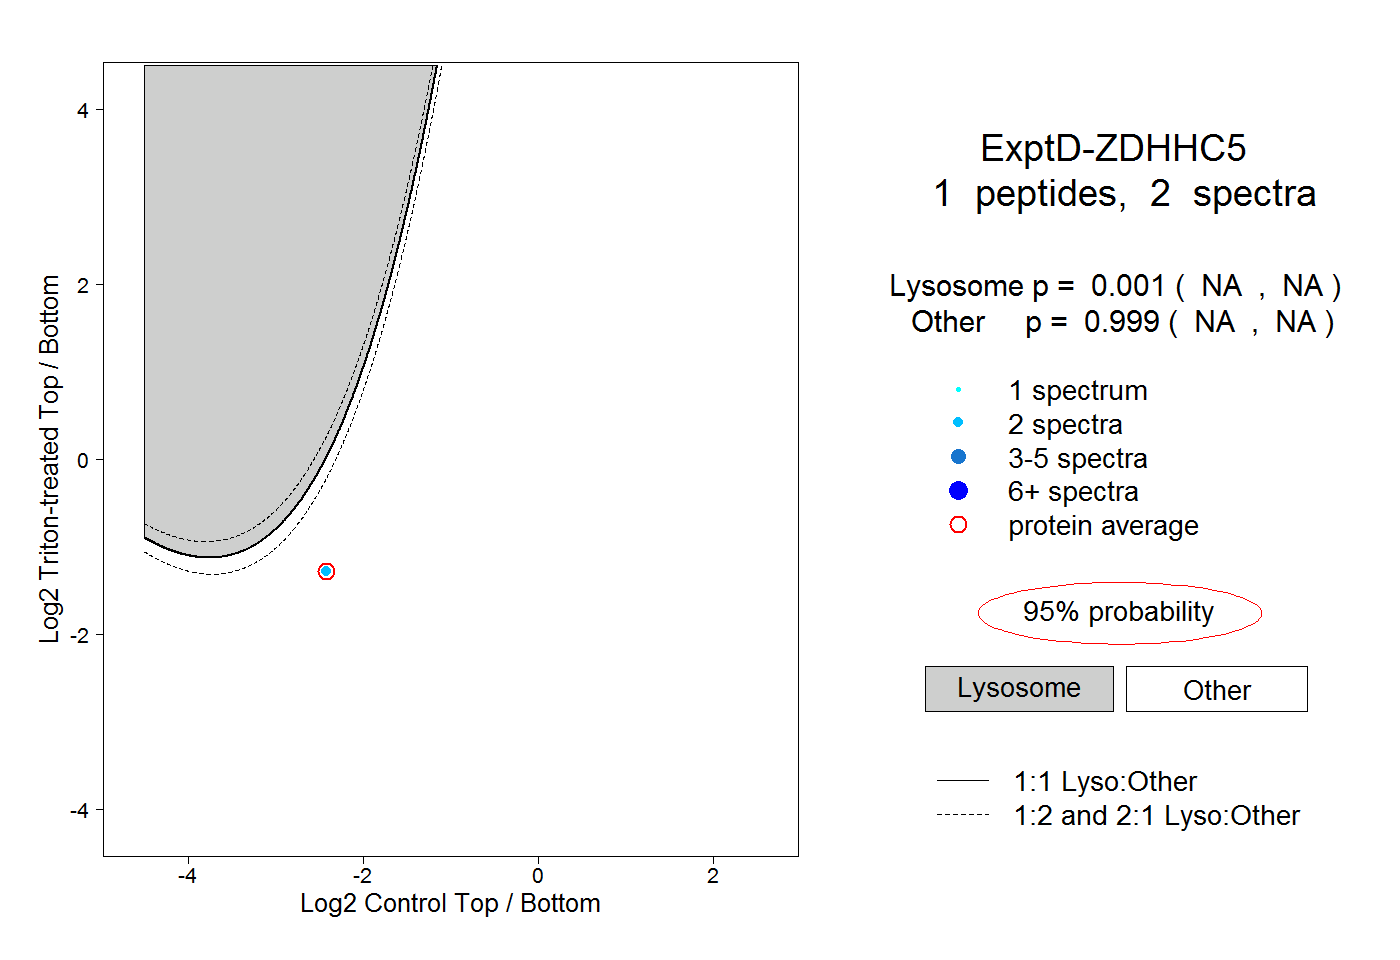
NA | NA
NA | NA