 4
4peptides
spectra
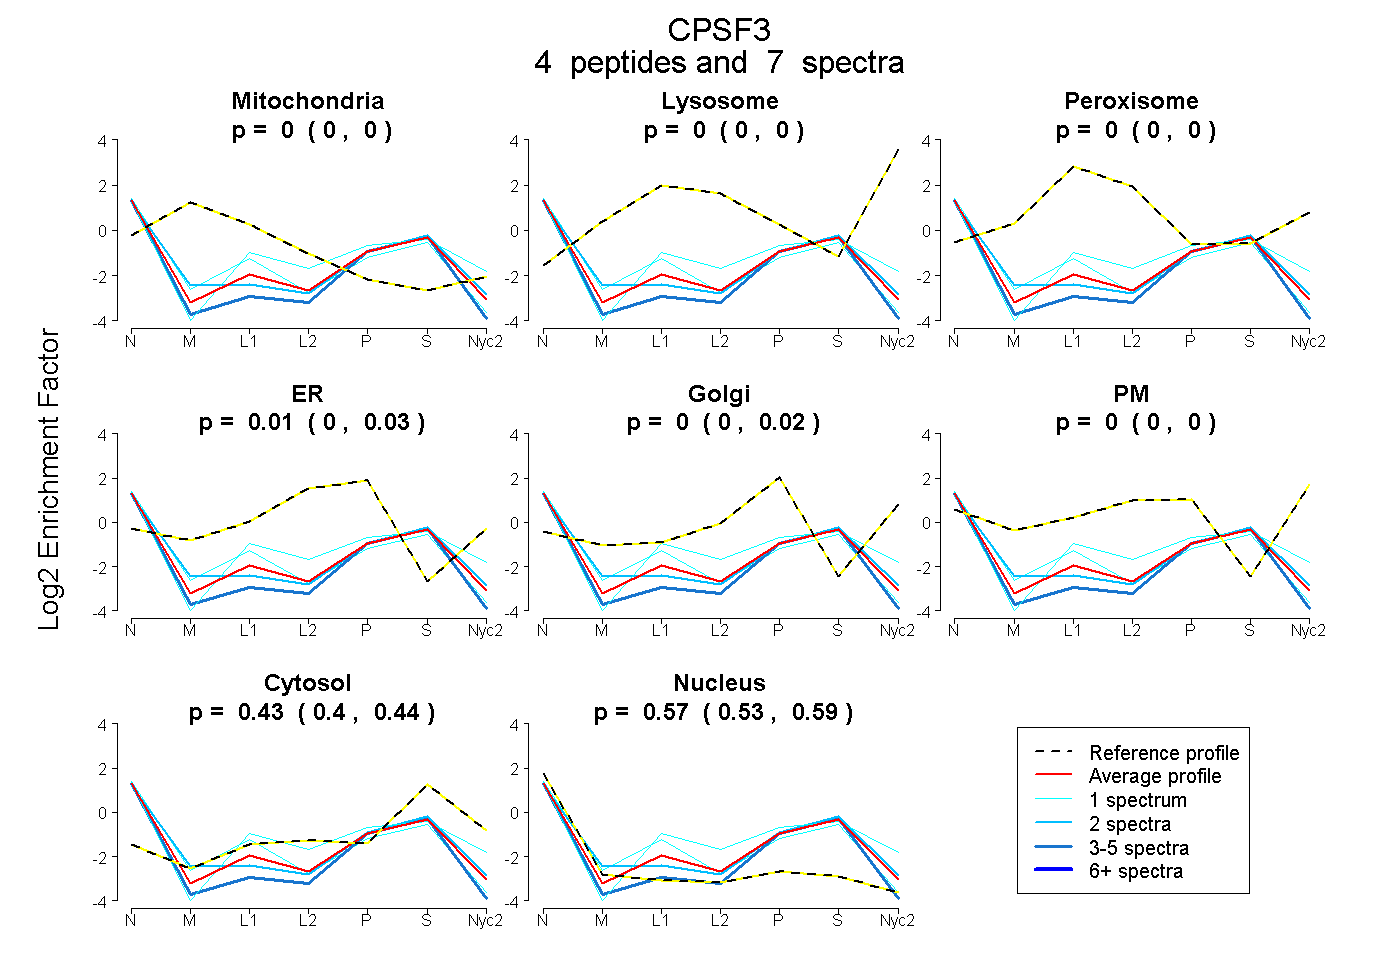
0.000 | 0.000
0.000 | 0.000
0.000 | 0.000
0.000 | 0.030
0.000 | 0.019
0.000 | 0.000
0.401 | 0.440
0.534 | 0.592
| Plot | Mito | Lyso | Perox | ER | Golgi | PM | Cytosol | Nucleus | |||||
| Expt A |
4 peptides |
7 spectra |
|
0.000 0.000 | 0.000 |
0.000 0.000 | 0.000 |
0.000 0.000 | 0.000 |
0.006 0.000 | 0.030 |
0.000 0.000 | 0.019 |
0.000 0.000 | 0.000 |
0.427 0.401 | 0.440 |
0.567 0.534 | 0.592 |
| 1 spectrum, LYEALTPPVH | 0.000 | 0.000 | 0.000 | 0.109 | 0.000 | 0.044 | 0.453 | 0.394 | ||
| 2 spectra, LLYTGDFSR | 0.000 | 0.000 | 0.000 | 0.000 | 0.024 | 0.000 | 0.423 | 0.553 | ||
| 3 spectra, GLIPVFALGR | 0.000 | 0.000 | 0.000 | 0.000 | 0.000 | 0.000 | 0.316 | 0.684 | ||
| 1 spectrum, EMVELAAQR | 0.000 | 0.000 | 0.065 | 0.000 | 0.000 | 0.000 | 0.309 | 0.626 |
| Plot | Mito | Lyso or Perox | ER | Golgi | PM | Cytosol | Nucleus | ||||||
| Expt B |
2 peptides |
2 spectra |
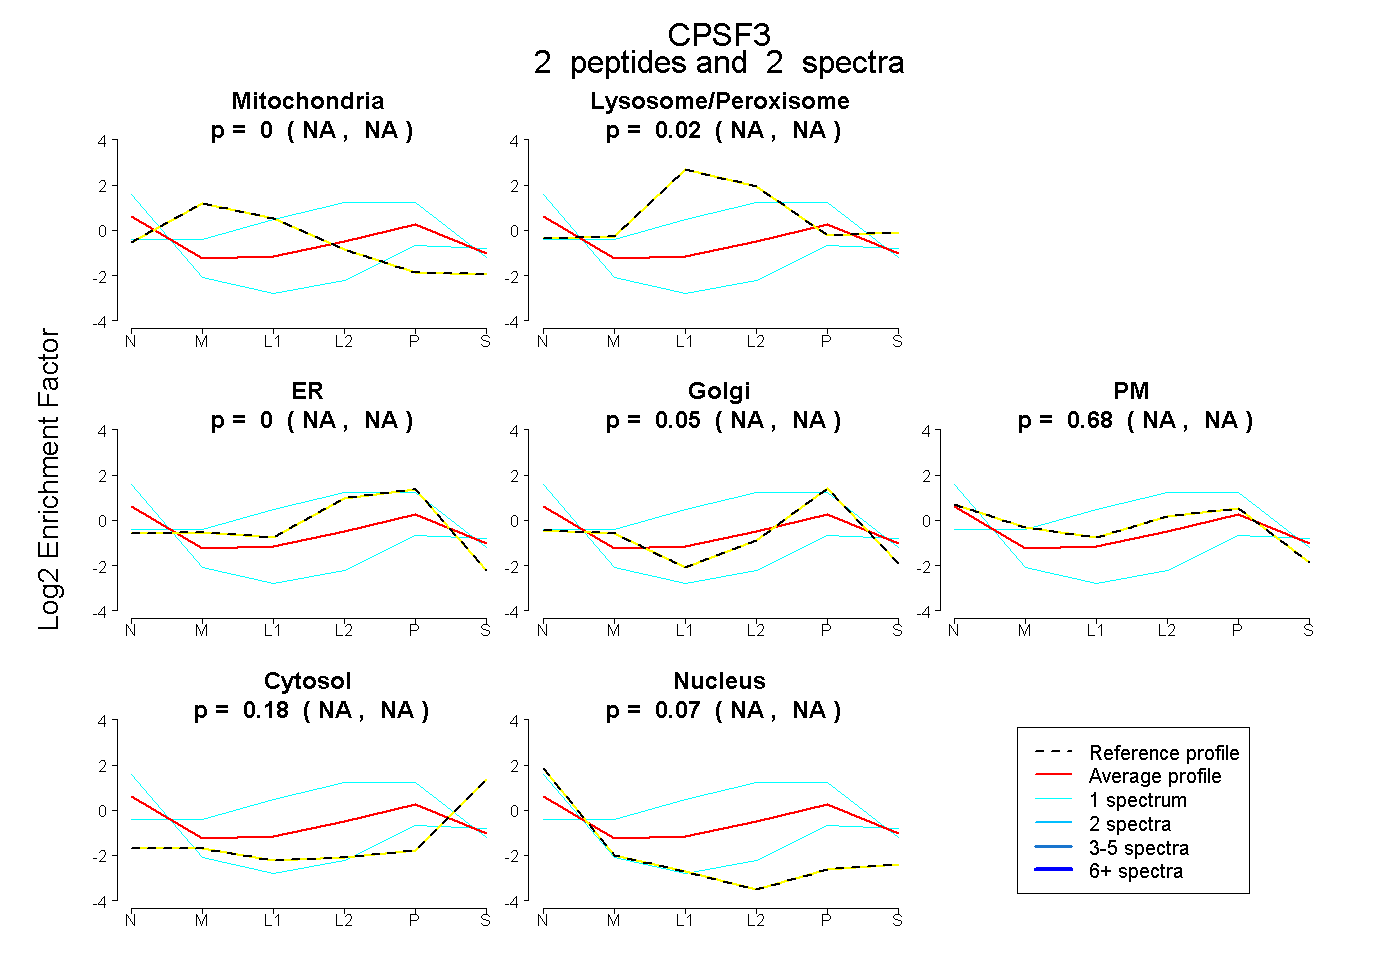 |
0.000 NA | NA |
0.016 NA | NA |
0.000 NA | NA |
0.051 NA | NA |
0.682 NA | NA |
0.185 NA | NA |
0.066 NA | NA |
|||
| Plot | Lyso | Other | |||||||||||
| Expt C |
1 peptide |
2 spectra |
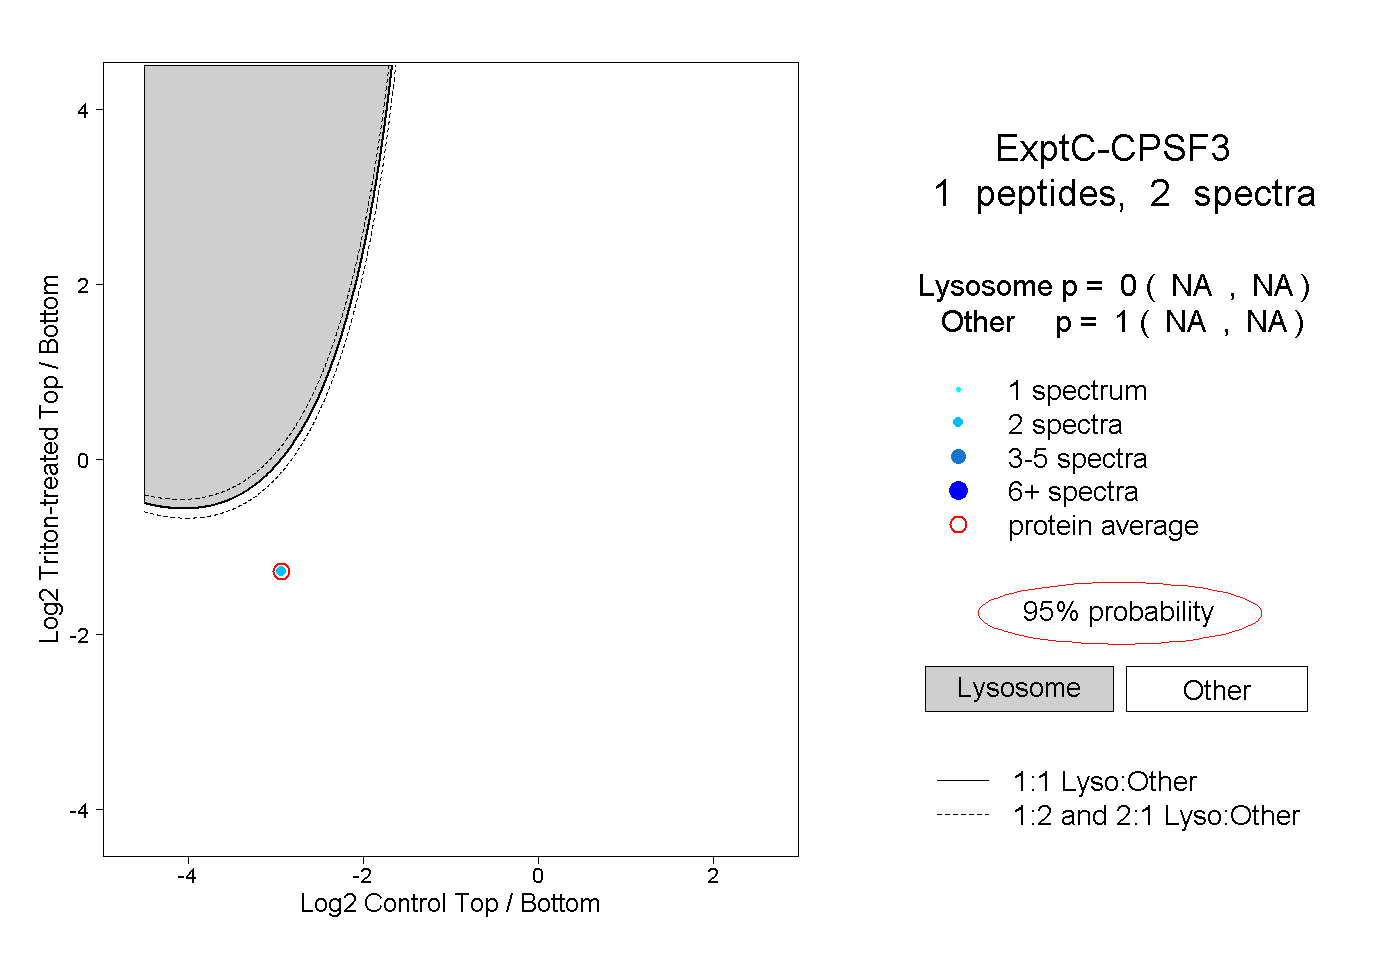 |
0.000 NA | NA |
1.000 NA | NA |