 10
10peptides
spectra
0.000 | 0.010
0.000 | 0.000
0.000 | 0.000
0.000 | 0.015
0.000 | 0.034
0.000 | 0.000
0.959 | 0.980
0.000 | 0.020
1peptide
spectra
NA | NA
NA | NA
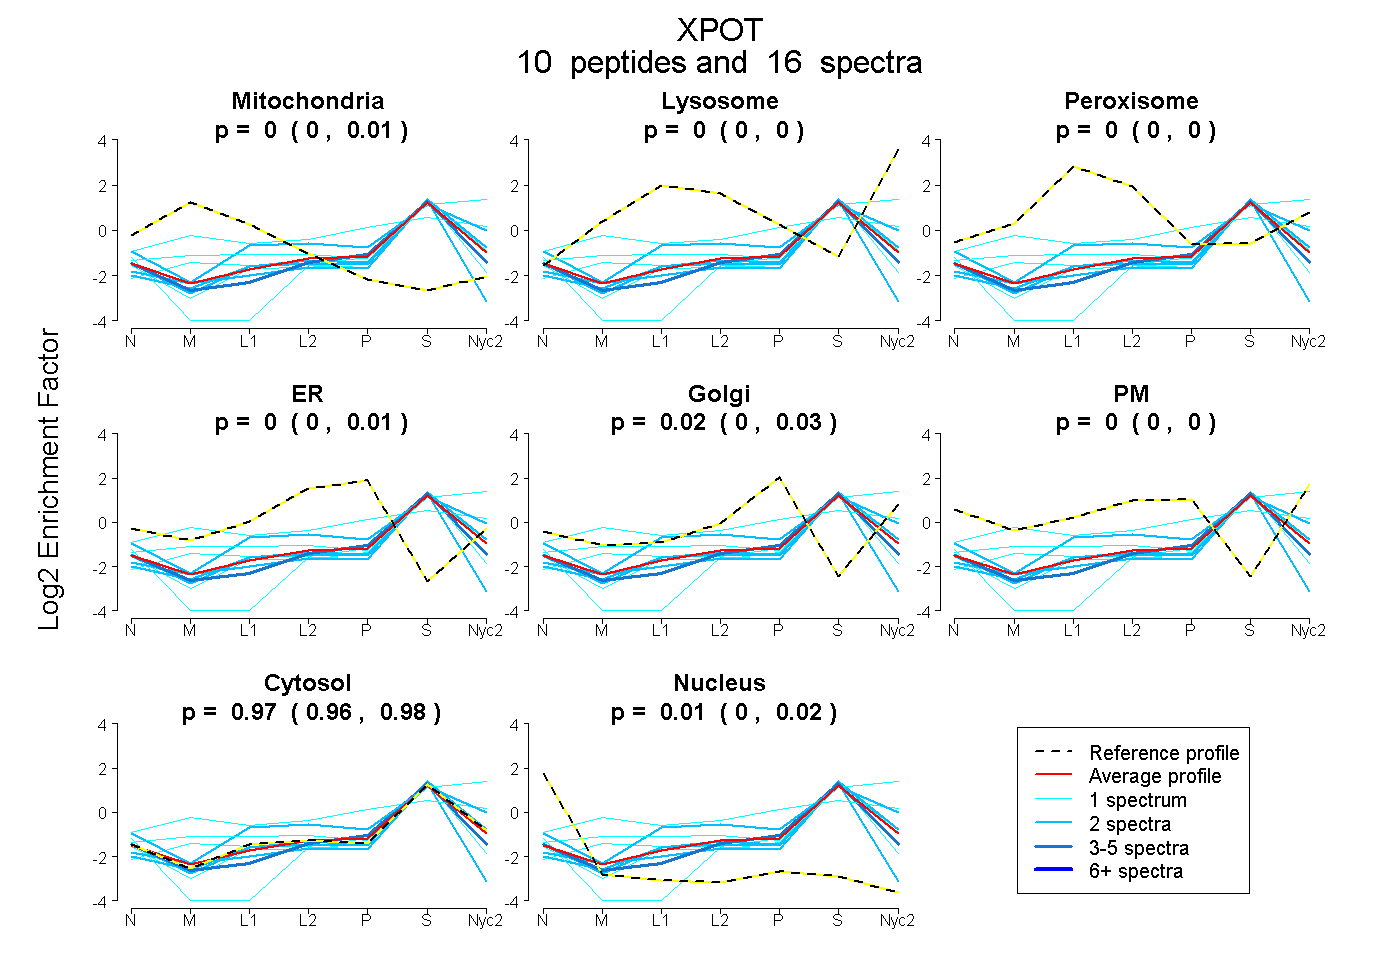
| Plot | Mito | Lyso | Perox | ER | Golgi | PM | Cytosol | Nucleus | |||||
| Expt A |
10 peptides |
16 spectra |
|
0.000 0.000 | 0.010 |
0.000 0.000 | 0.000 |
0.000 0.000 | 0.000 |
0.000 0.000 | 0.015 |
0.022 0.000 | 0.034 |
0.000 0.000 | 0.000 |
0.972 0.959 | 0.980 |
0.007 0.000 | 0.020 |
||
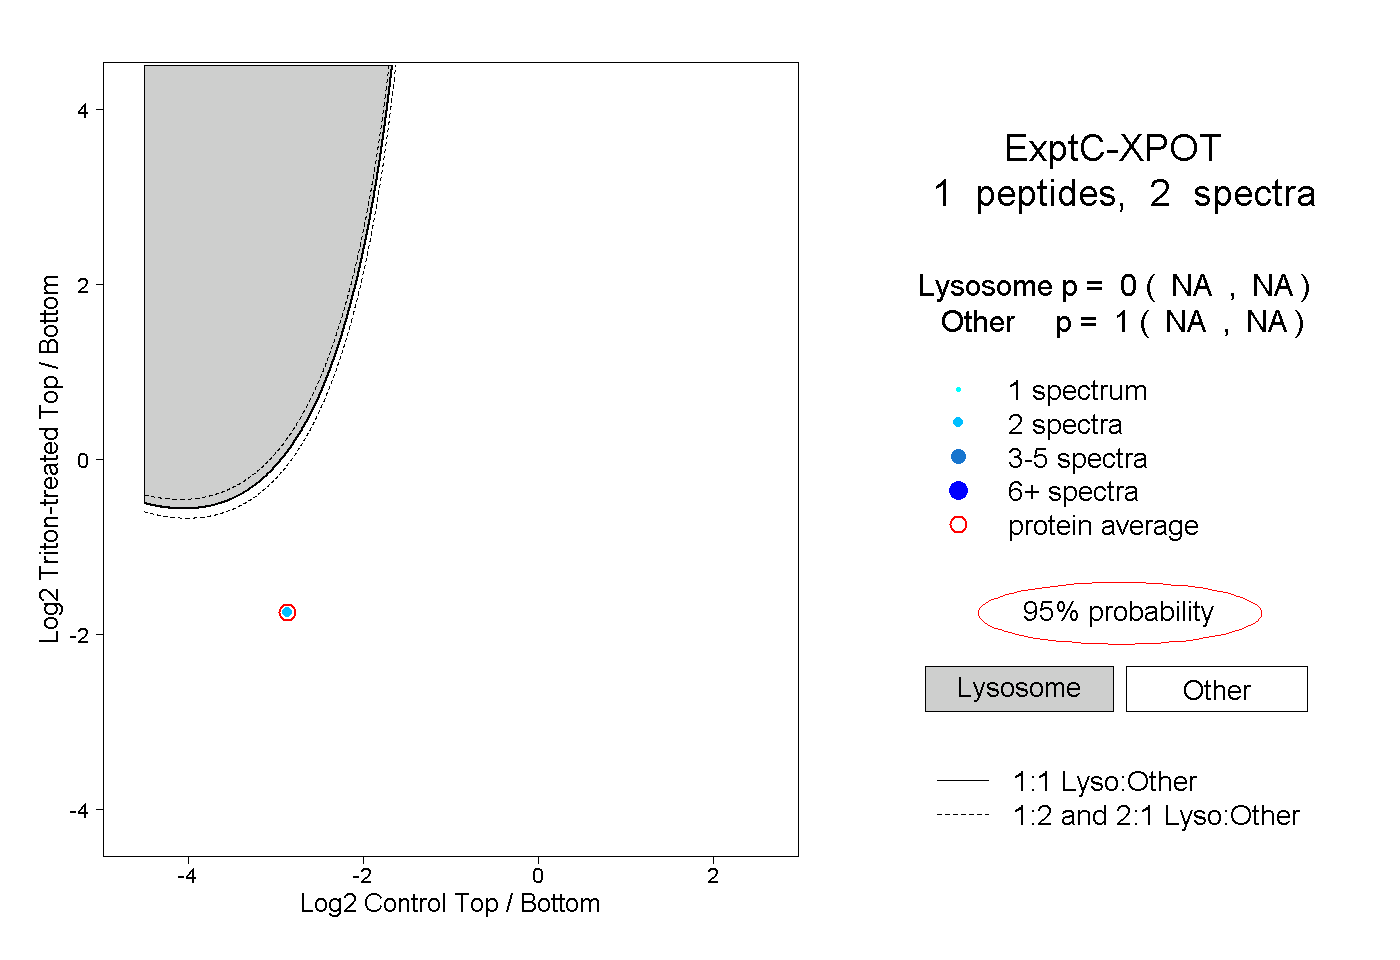
| Plot | Lyso | Other | |||||||||||
| Expt C |
1 peptide |
2 spectra |
|
0.000 NA | NA |
1.000 NA | NA |