 13
13peptides
spectra
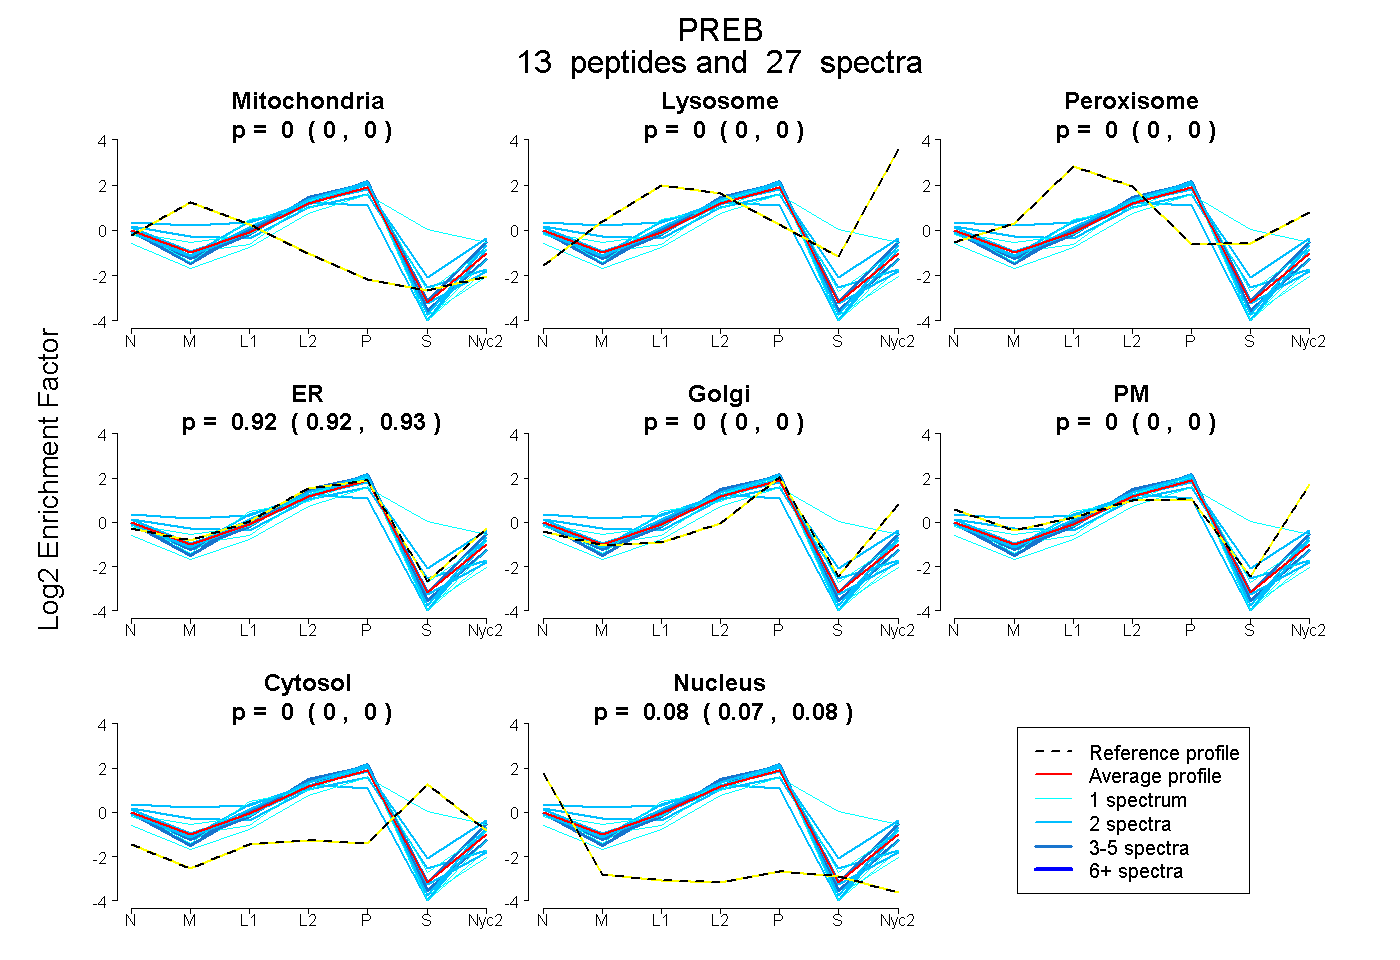
0.000 | 0.000
0.000 | 0.000
0.000 | 0.000
0.919 | 0.927
0.000 | 0.000
0.000 | 0.000
0.000 | 0.000
0.073 | 0.081
8peptides
spectra
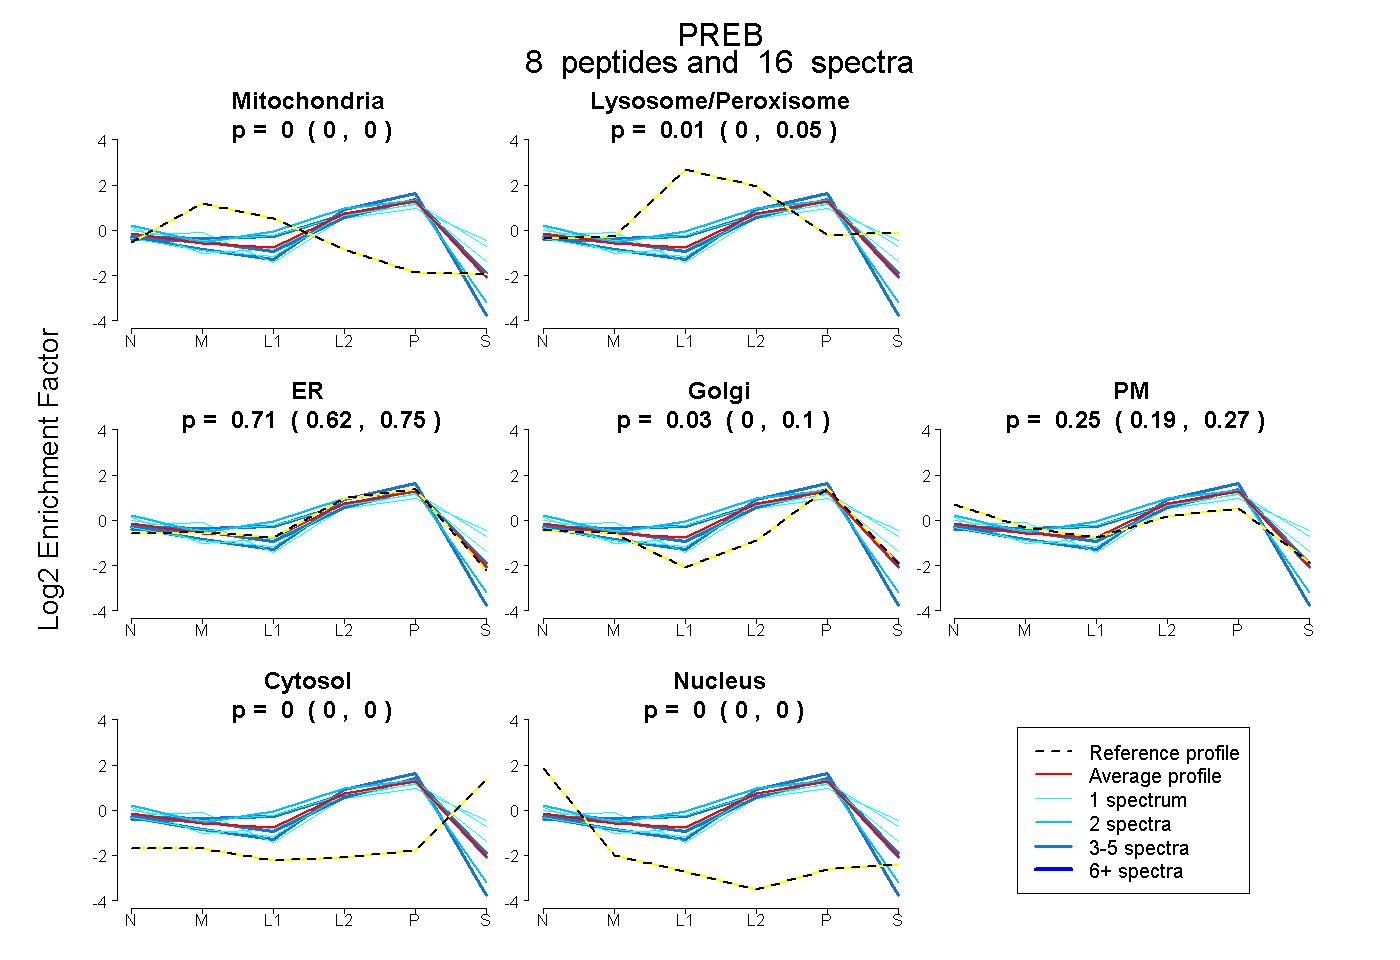
0.000 | 0.000
0.000 | 0.052
0.625 | 0.746
0.000 | 0.102
0.194 | 0.269
0.000 | 0.000
0.000 | 0.000
10peptides
spectra
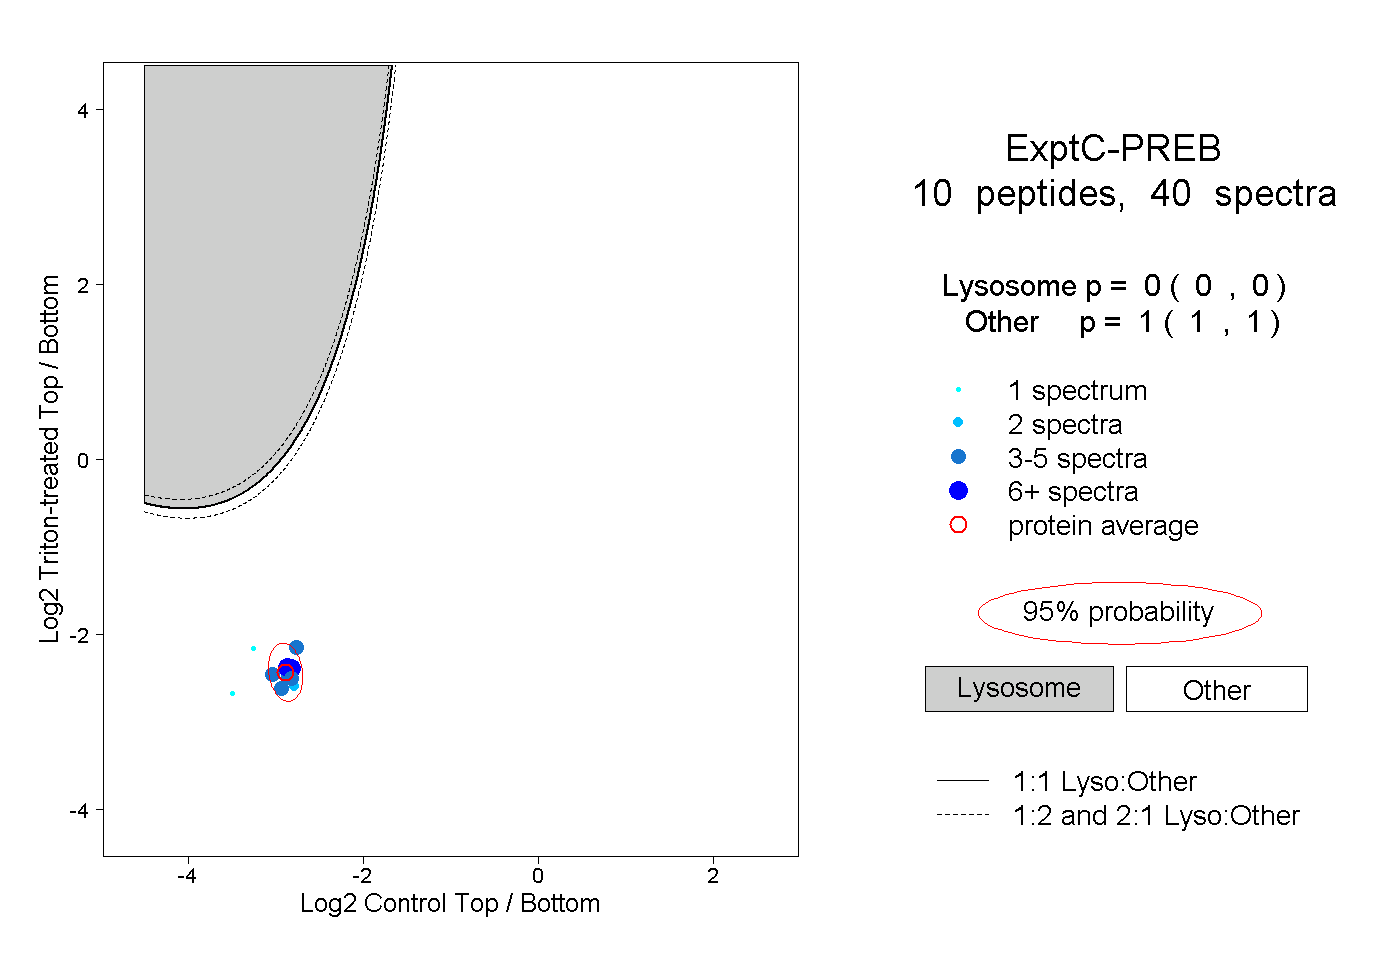
0.000 | 0.000
1.000 | 1.000
5peptides
spectra
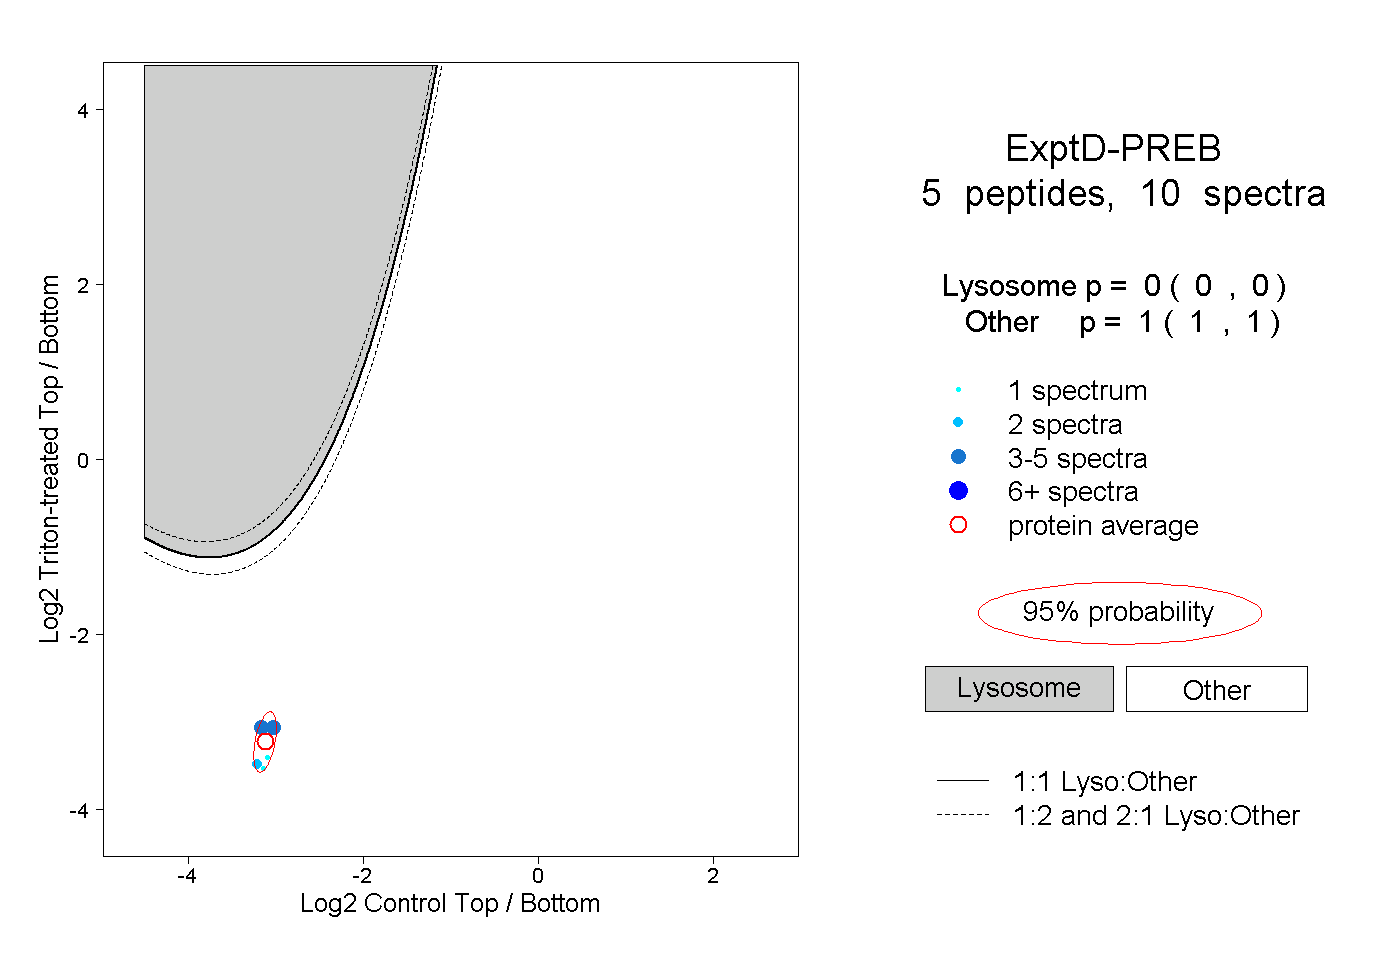
0.000 | 0.000
1.000 | 1.000