 18
18peptides
spectra
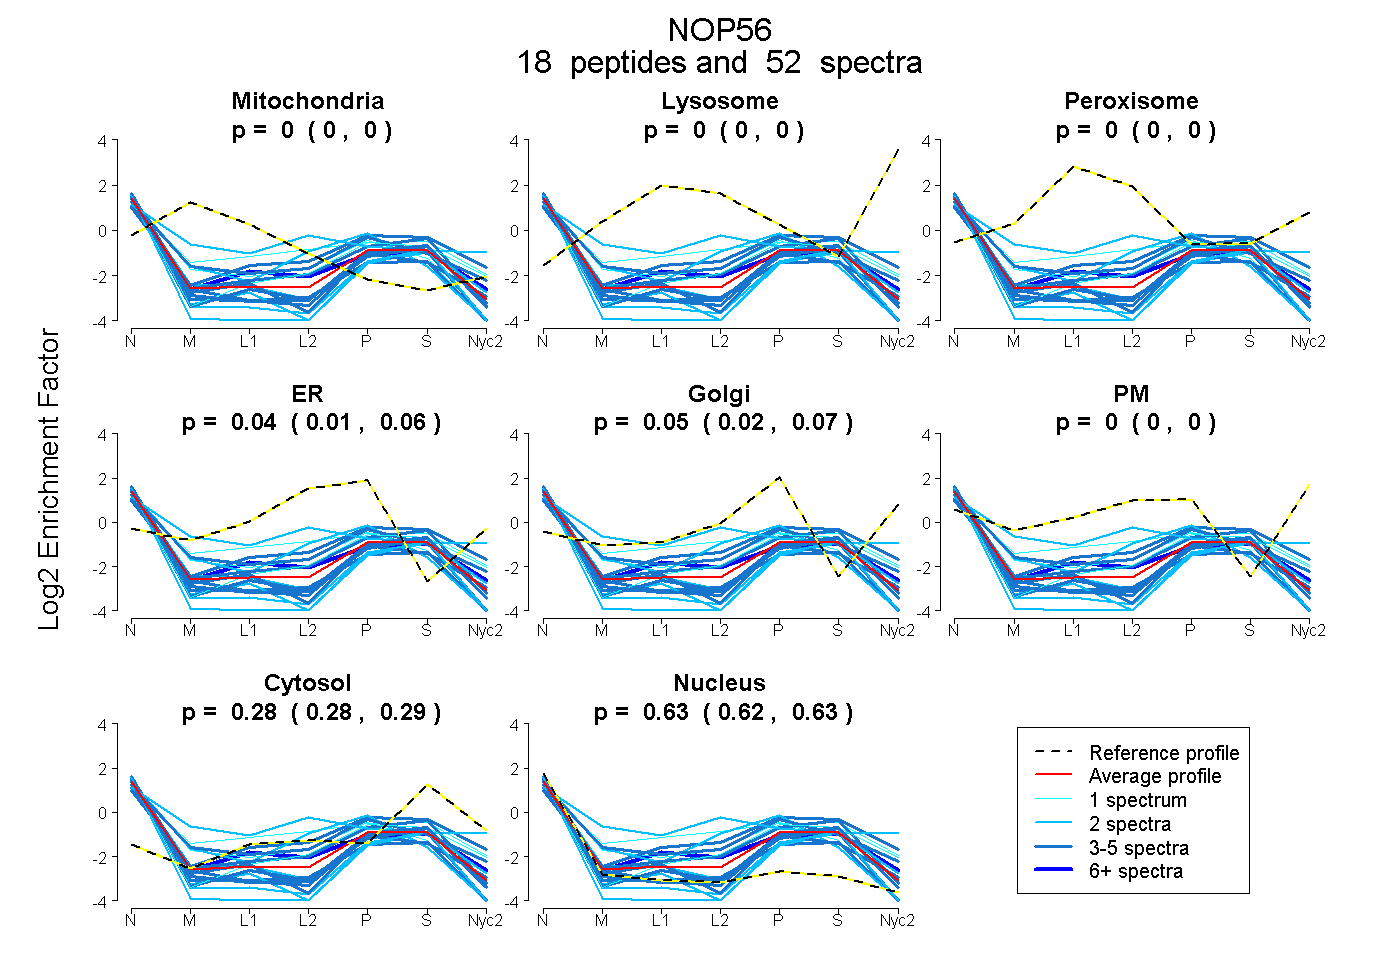
0.000 | 0.000
0.000 | 0.000
0.000 | 0.000
0.008 | 0.058
0.022 | 0.075
0.000 | 0.000
0.279 | 0.289
0.622 | 0.634
8peptides
spectra
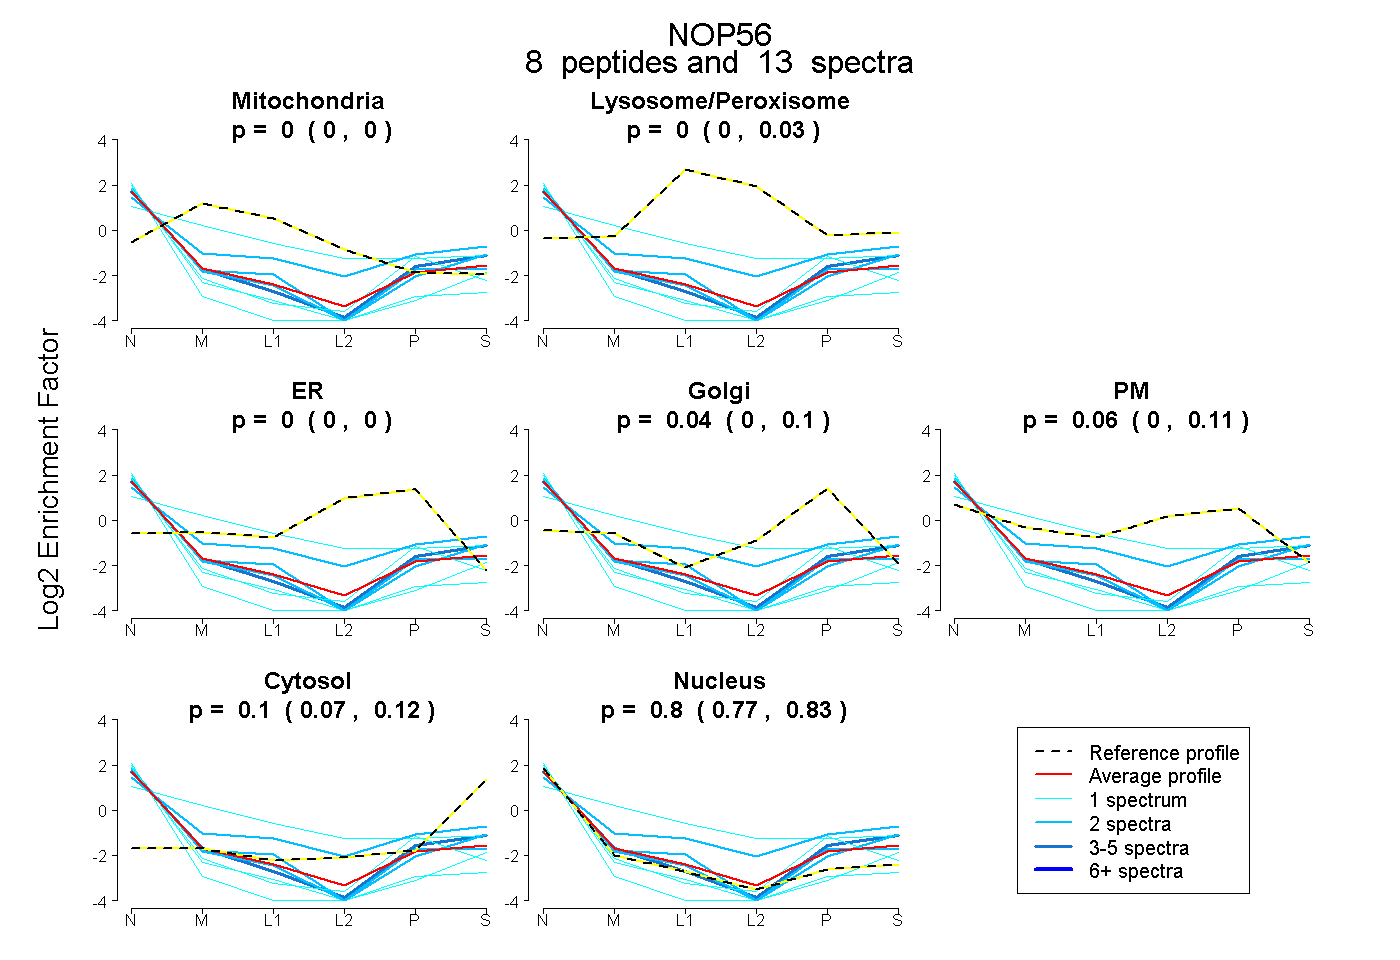
0.000 | 0.000
0.000 | 0.026
0.000 | 0.000
0.000 | 0.096
0.000 | 0.111
0.070 | 0.120
0.769 | 0.828