 18
18peptides
spectra
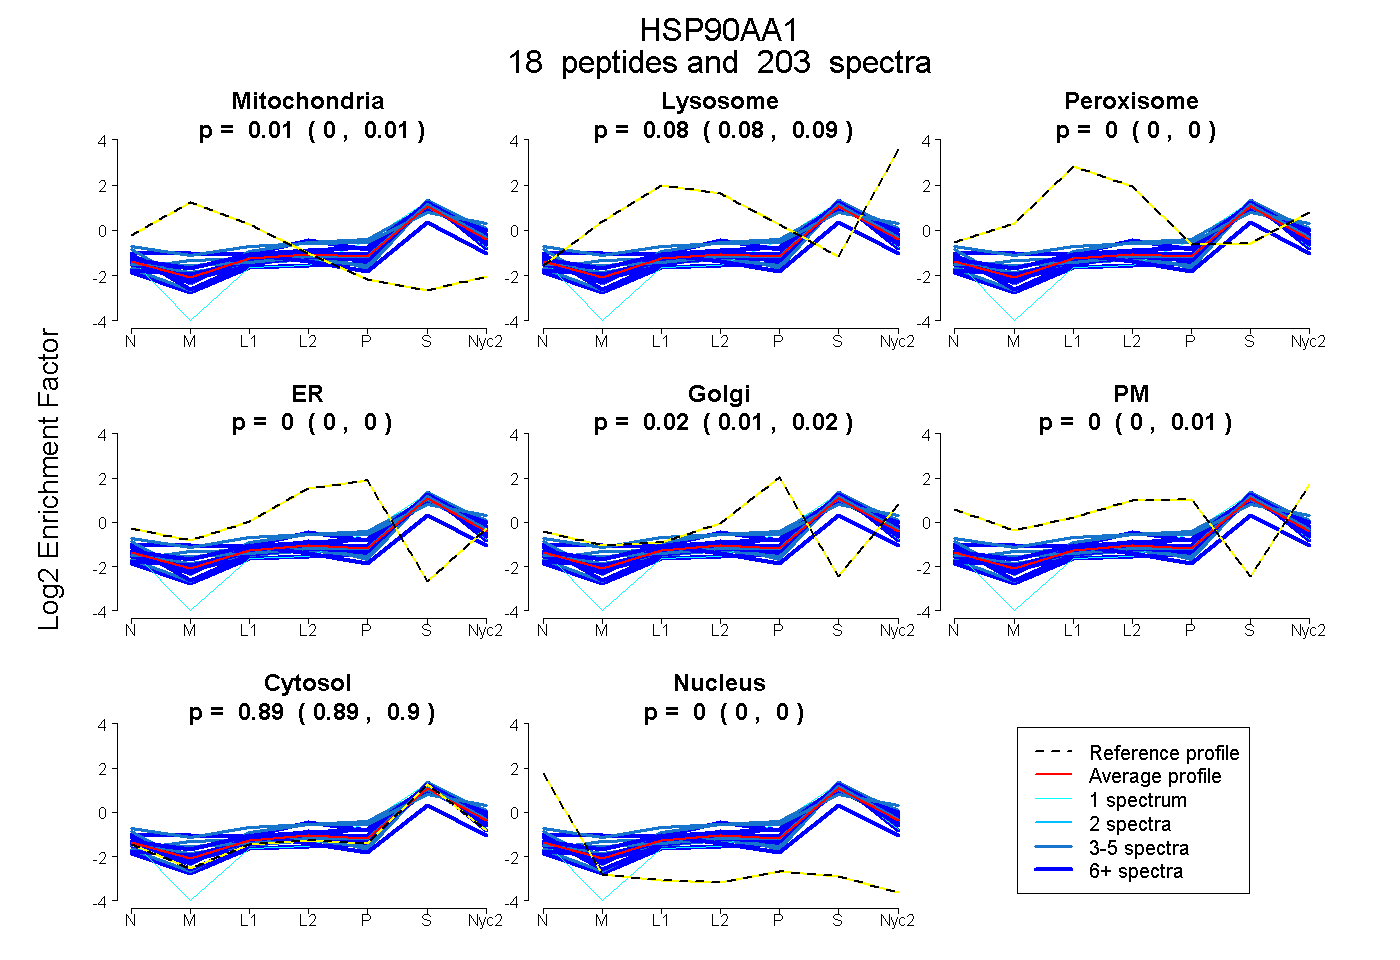
0.005 | 0.010
0.081 | 0.086
0.000 | 0.000
0.000 | 0.000
0.009 | 0.018
0.000 | 0.006
0.890 | 0.895
0.000 | 0.000
23peptides
spectra
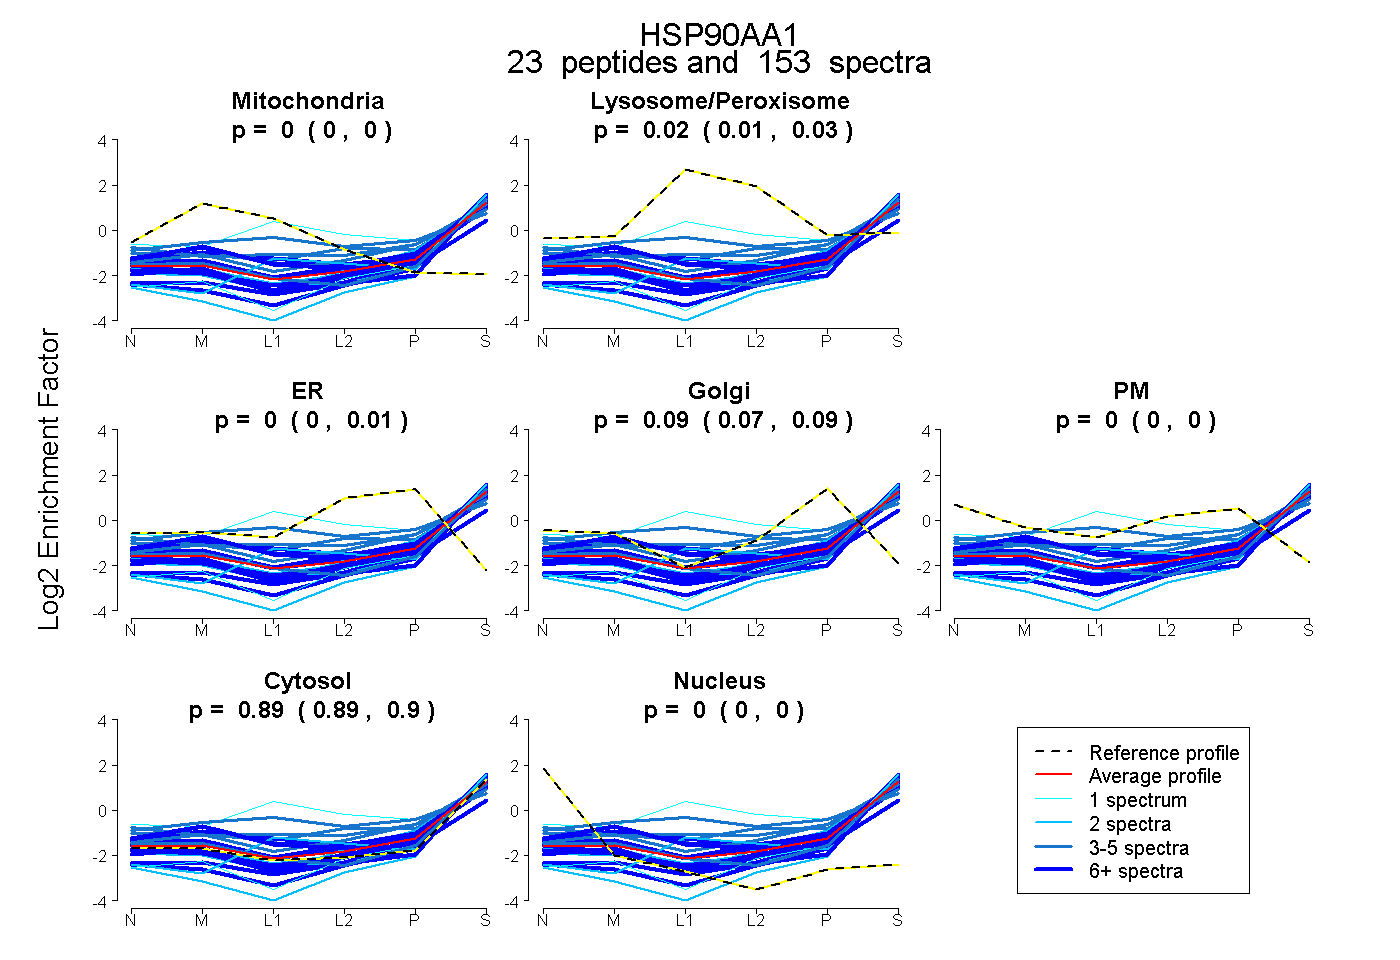
0.000 | 0.000
0.015 | 0.026
0.000 | 0.012
0.071 | 0.089
0.000 | 0.000
0.889 | 0.895
0.000 | 0.000
17peptides
spectra
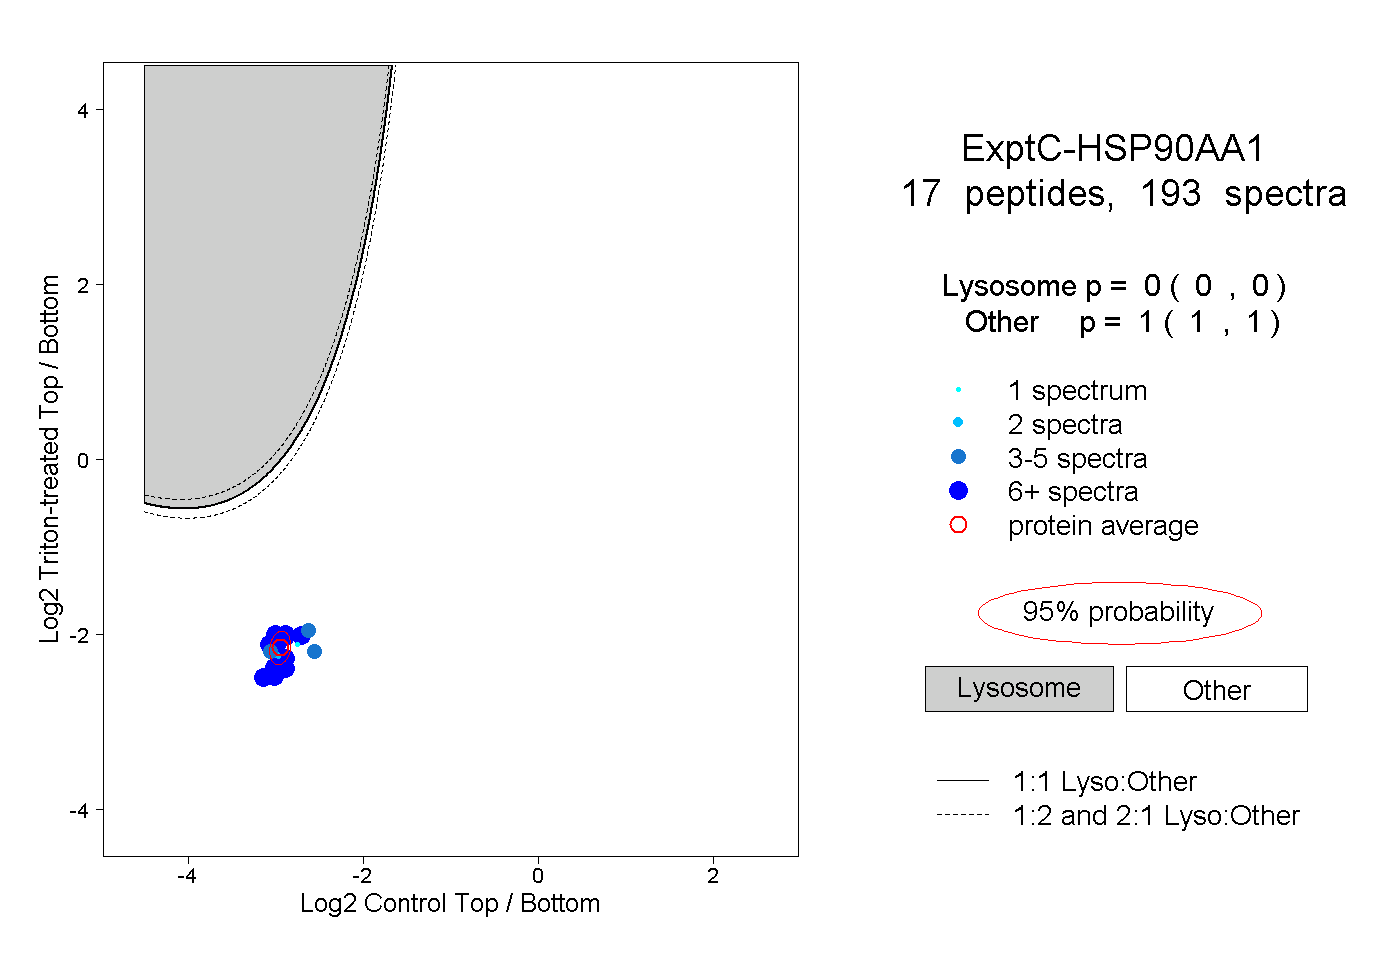
0.000 | 0.000
1.000 | 1.000
13peptides
spectra
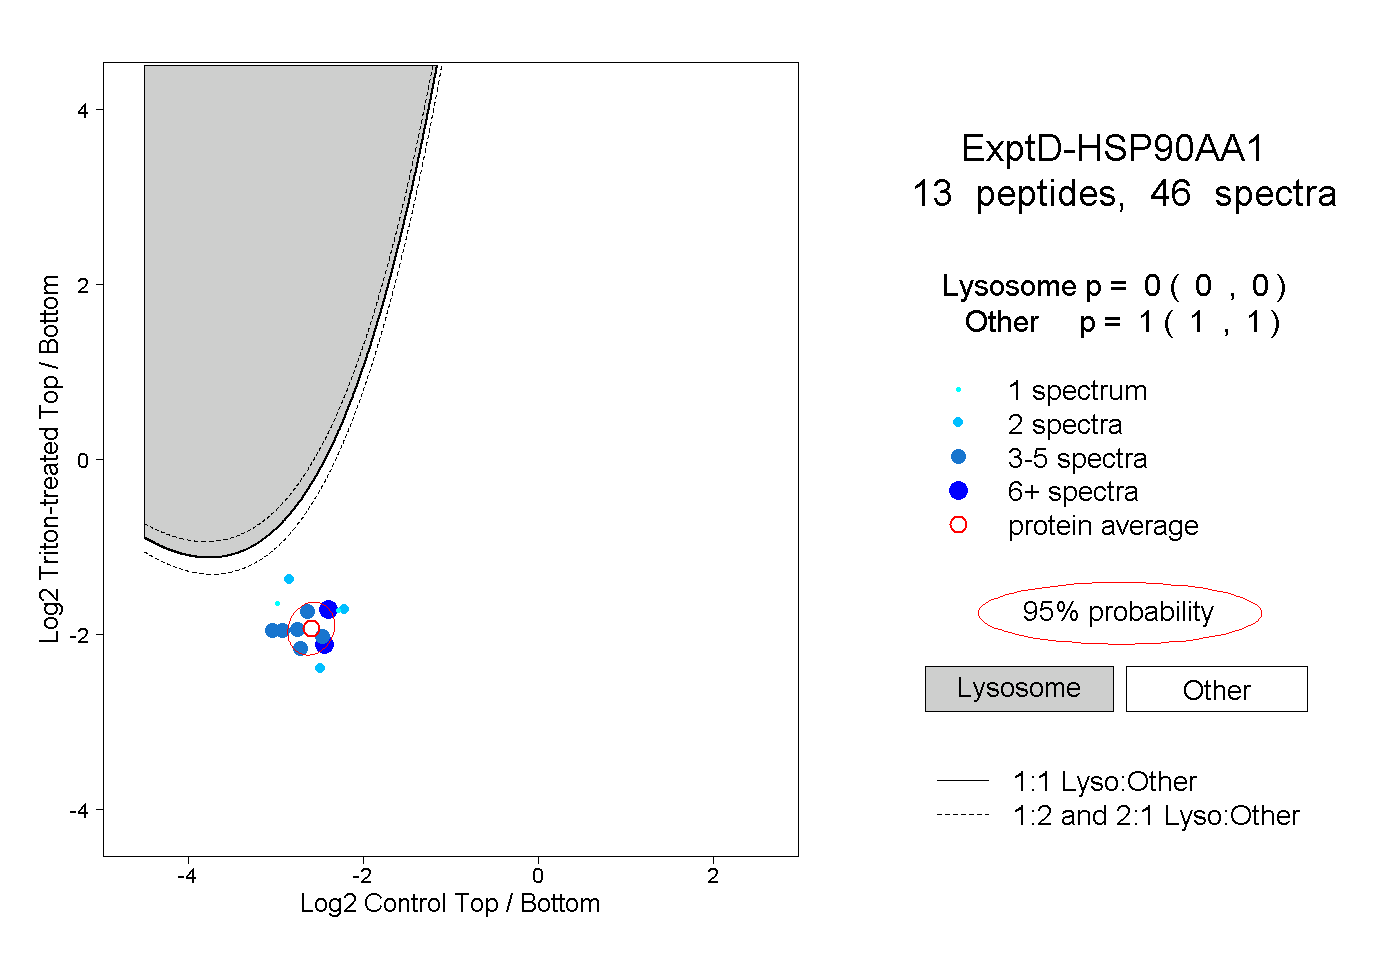
0.000 | 0.000
1.000 | 1.000