 3
3peptides
spectra
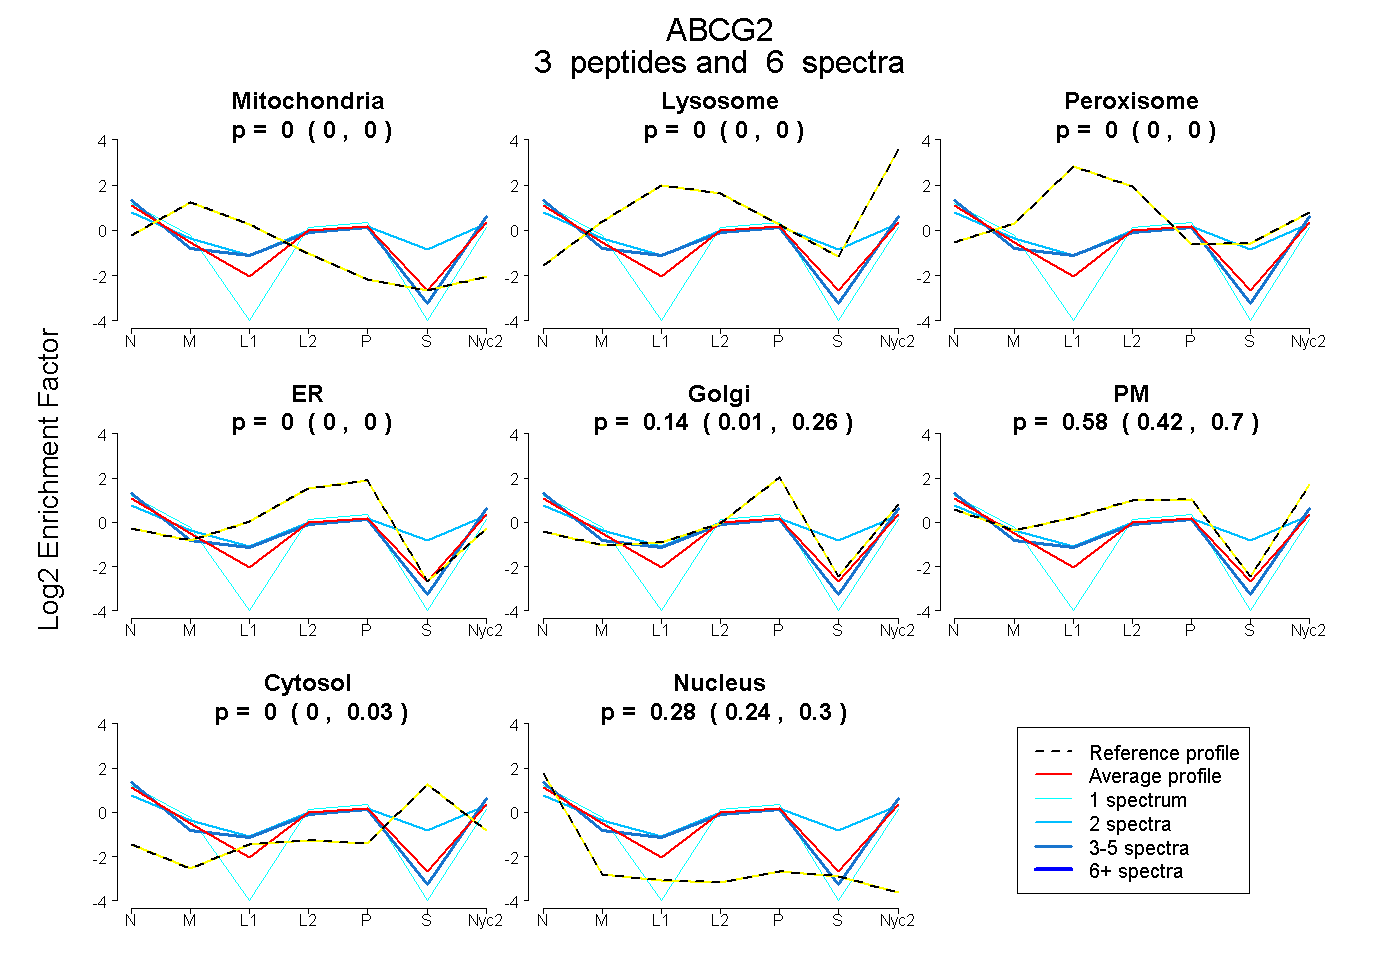
0.000 | 0.000
0.000 | 0.000
0.000 | 0.000
0.000 | 0.000
0.011 | 0.263
0.419 | 0.696
0.000 | 0.032
0.241 | 0.298
4peptides
spectra
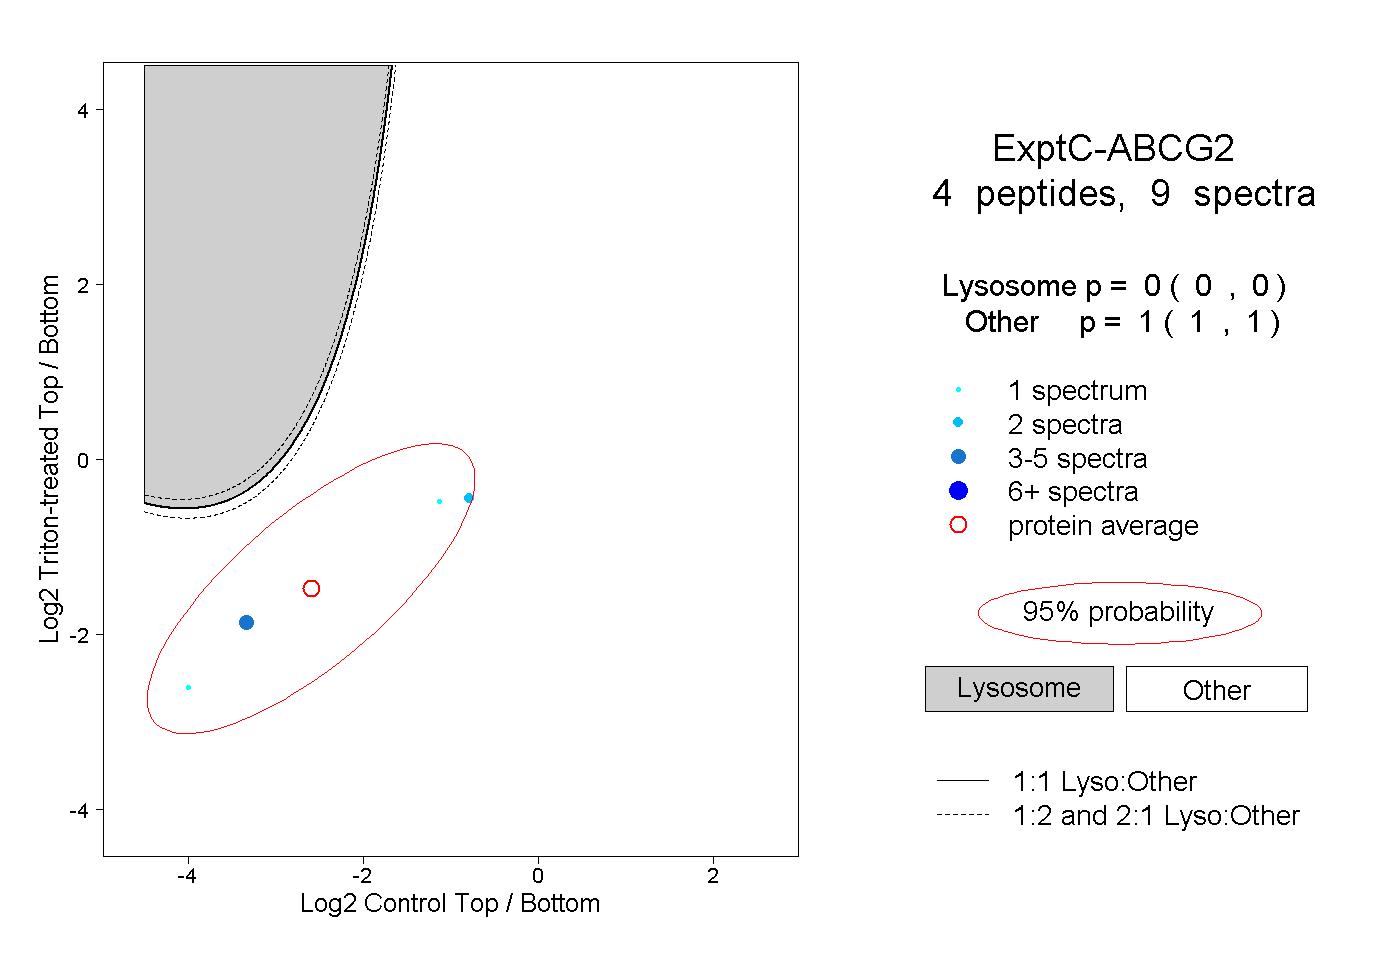
0.000 | 0.000
1.000 | 1.000
| Plot | Mito | Lyso | Perox | ER | Golgi | PM | Cytosol | Nucleus | |||||
| Expt A |
3 peptides |
6 spectra |
|
0.000 0.000 | 0.000 |
0.000 0.000 | 0.000 |
0.000 0.000 | 0.000 |
0.000 0.000 | 0.000 |
0.144 0.011 | 0.263 |
0.578 0.419 | 0.696 |
0.000 0.000 | 0.032 |
0.278 0.241 | 0.298 |
||
| Plot | Lyso | Other | |||||||||||
| Expt C |
4 peptides |
9 spectra |
|
0.000 0.000 | 0.000 |
1.000 1.000 | 1.000 |