 3
3peptides
spectra
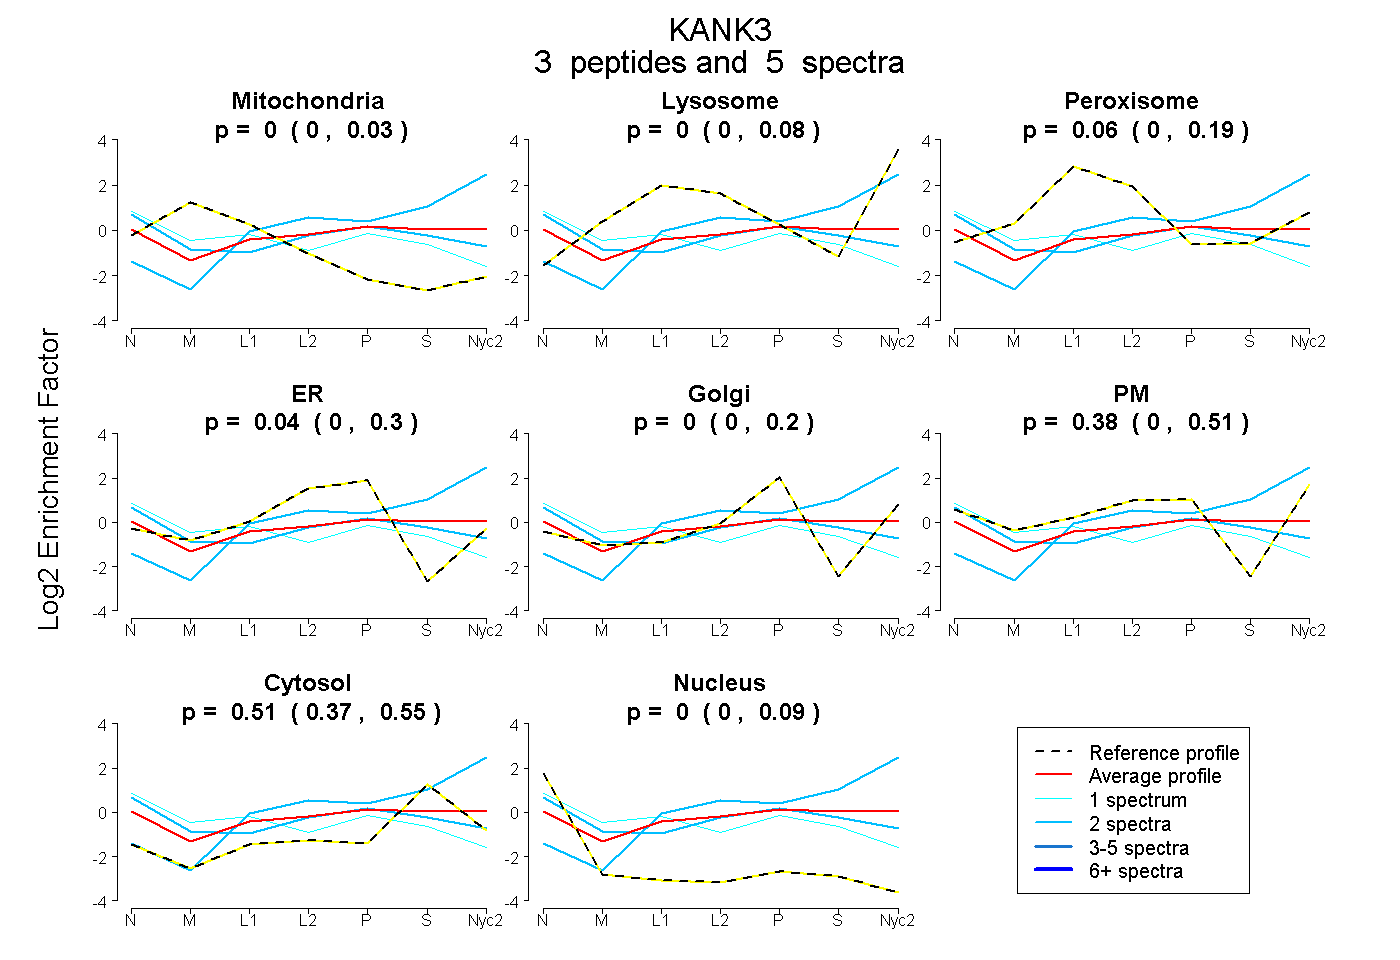
0.000 | 0.032
0.000 | 0.085
0.000 | 0.186
0.000 | 0.300
0.000 | 0.203
0.000 | 0.511
0.373 | 0.548
0.000 | 0.091
2peptides
spectra
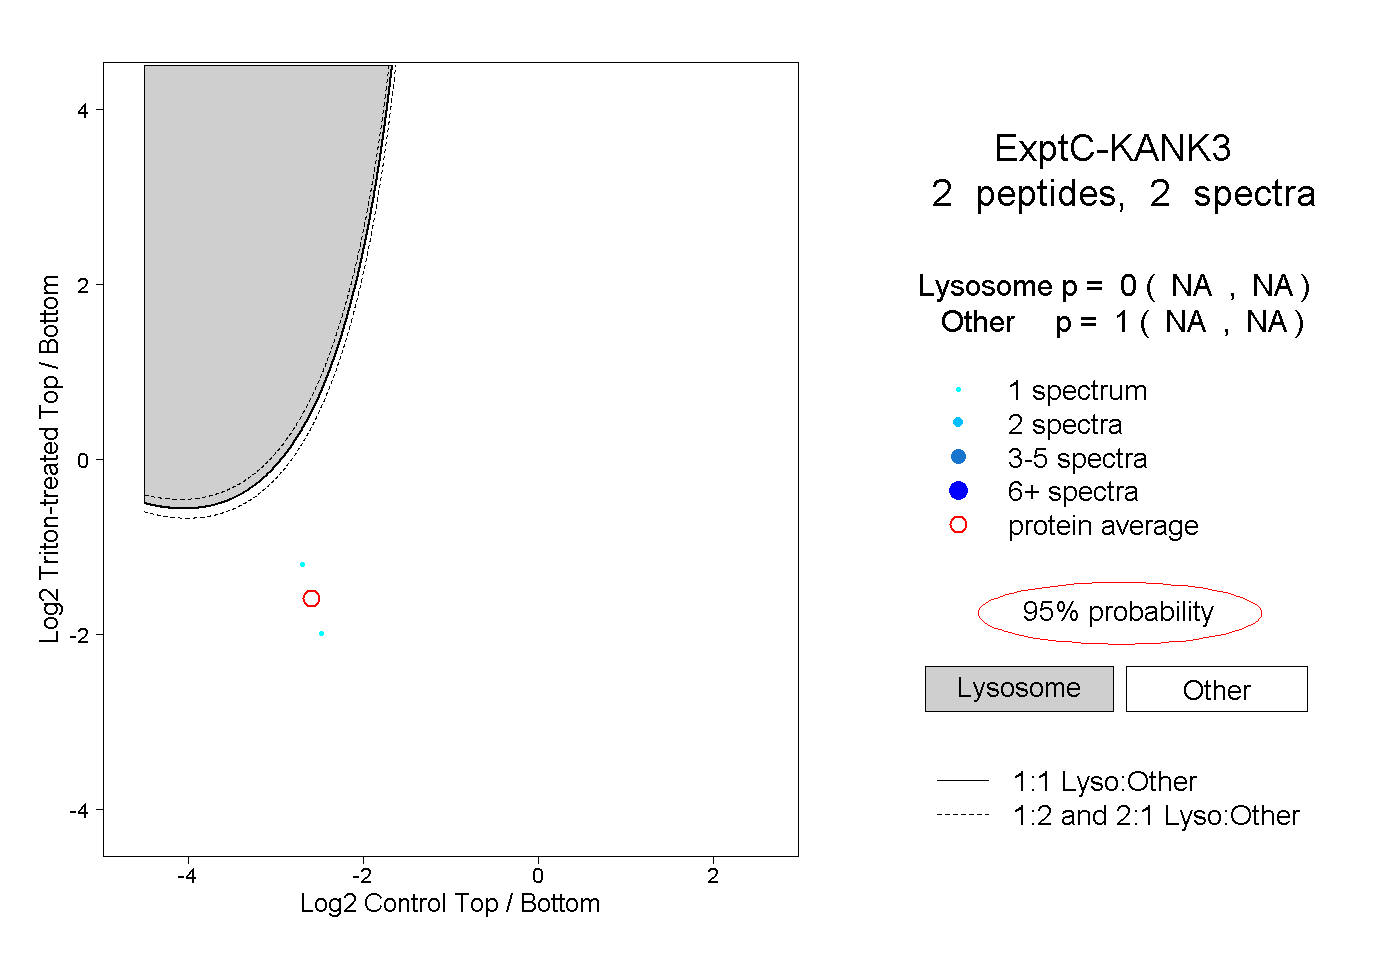
NA | NA
NA | NA
| Plot | Mito | Lyso | Perox | ER | Golgi | PM | Cytosol | Nucleus | |||||
| Expt A |
3 peptides |
5 spectra |
|
0.000 0.000 | 0.032 |
0.000 0.000 | 0.085 |
0.061 0.000 | 0.186 |
0.045 0.000 | 0.300 |
0.000 0.000 | 0.203 |
0.382 0.000 | 0.511 |
0.512 0.373 | 0.548 |
0.000 0.000 | 0.091 |
||
| Plot | Lyso | Other | |||||||||||
| Expt C |
2 peptides |
2 spectra |
|
0.000 NA | NA |
1.000 NA | NA |