 4
4peptides
spectra
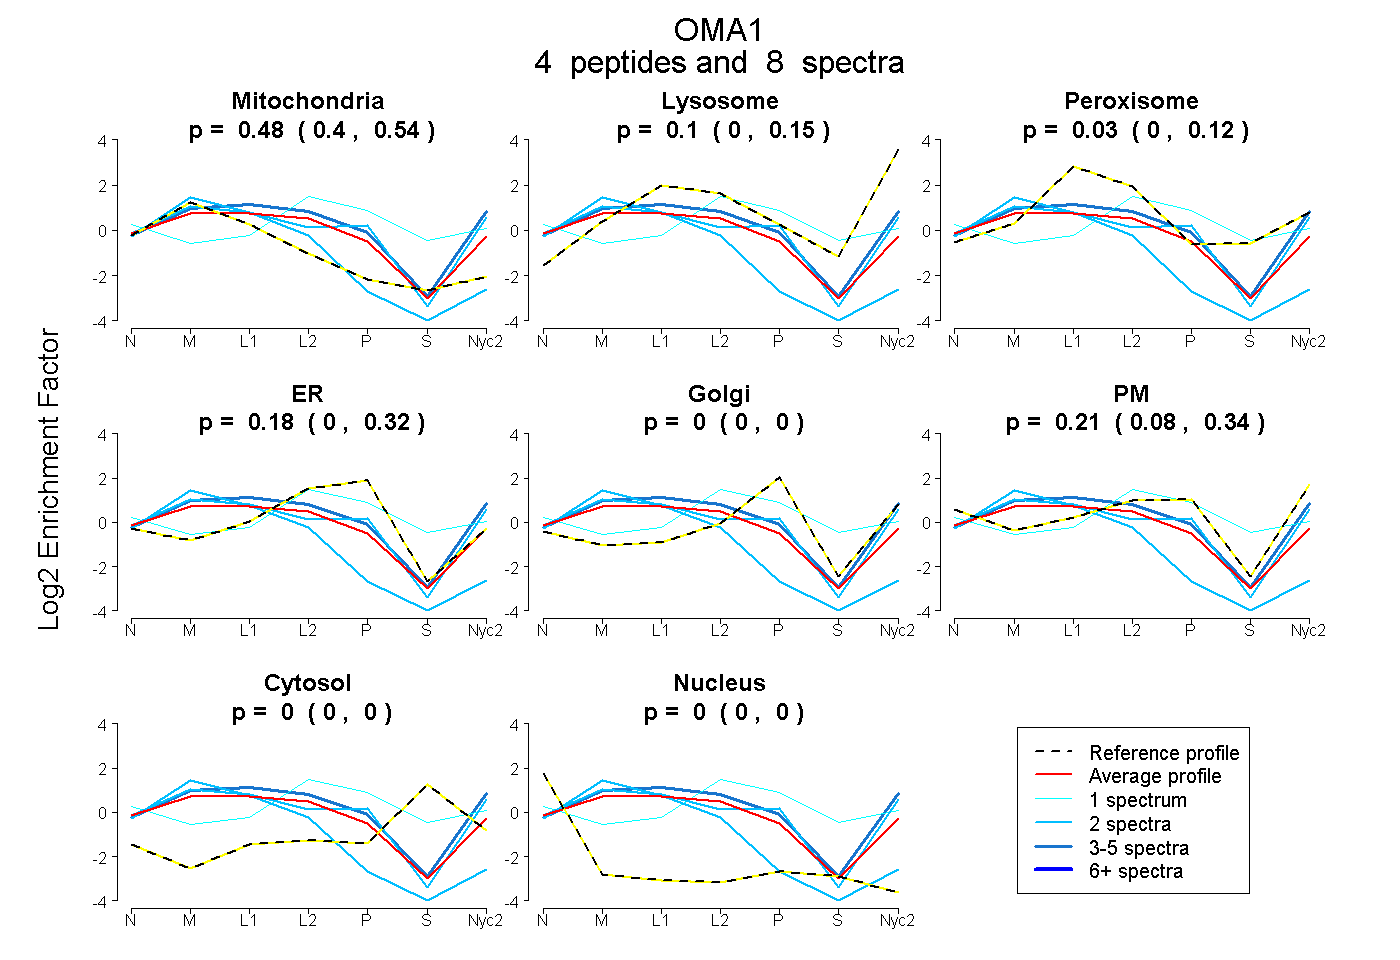
0.400 | 0.543
0.000 | 0.154
0.000 | 0.124
0.000 | 0.316
0.000 | 0.000
0.079 | 0.340
0.000 | 0.000
0.000 | 0.000
1peptide
spectrum
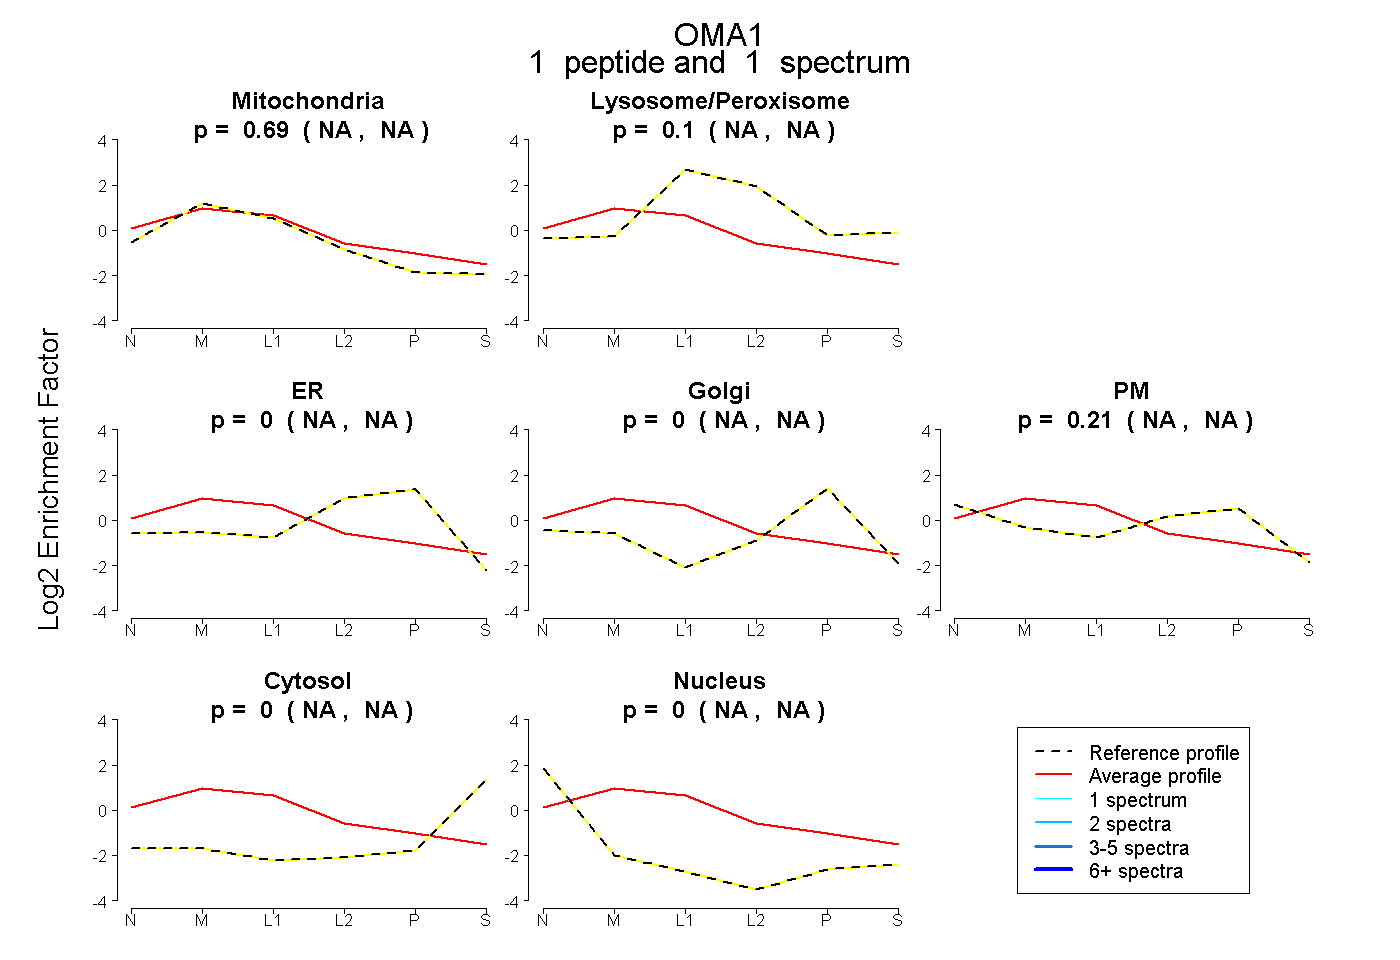
NA | NA
NA | NA
NA | NA
NA | NA
NA | NA
NA | NA
NA | NA
7peptides
spectra
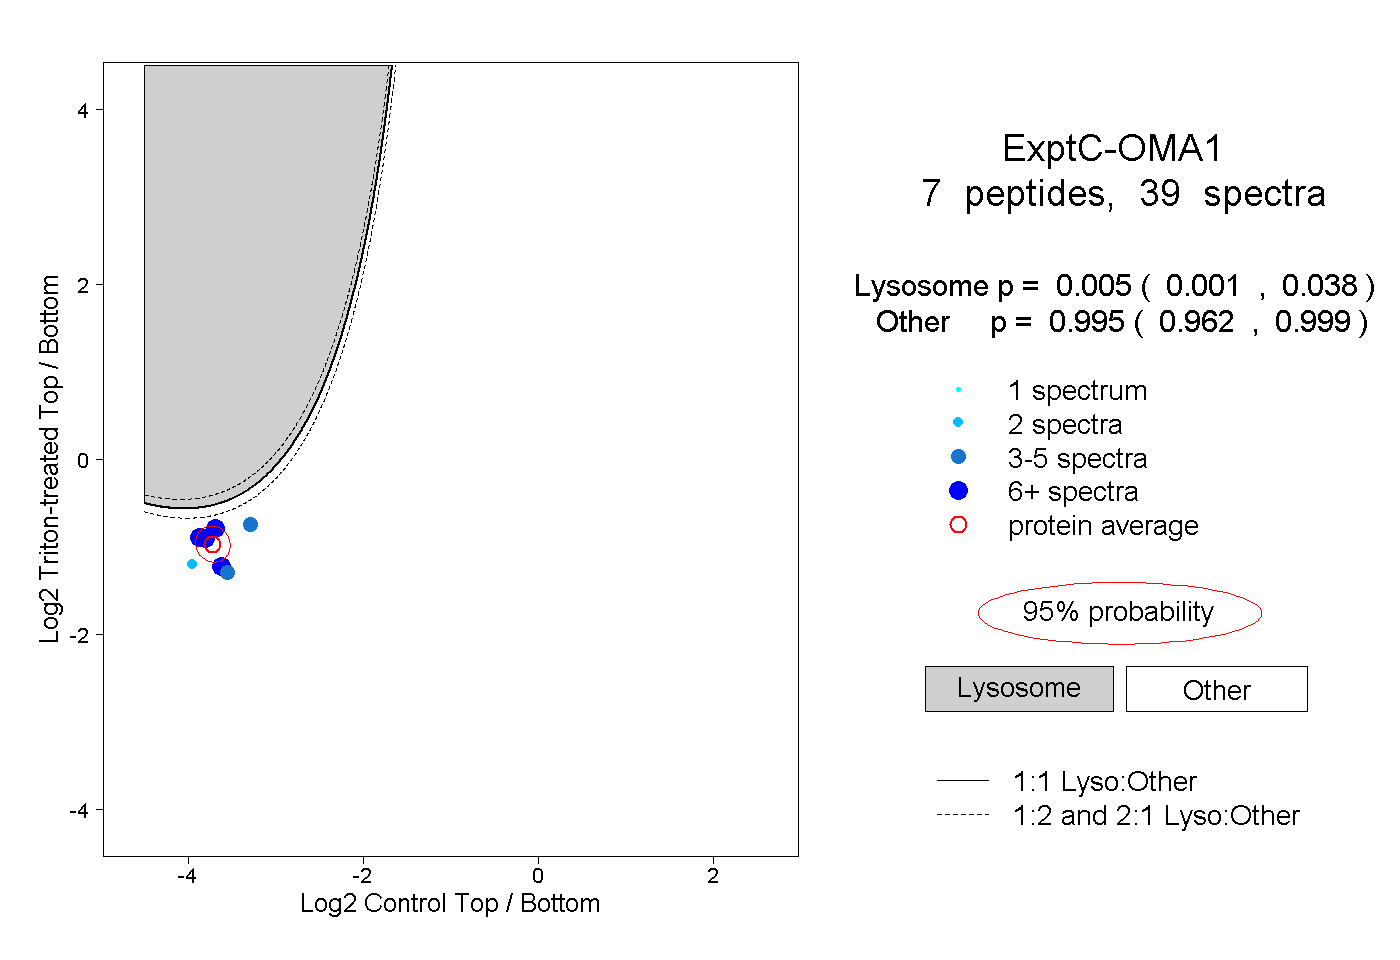
0.001 | 0.038
0.962 | 0.999
1peptide
spectra
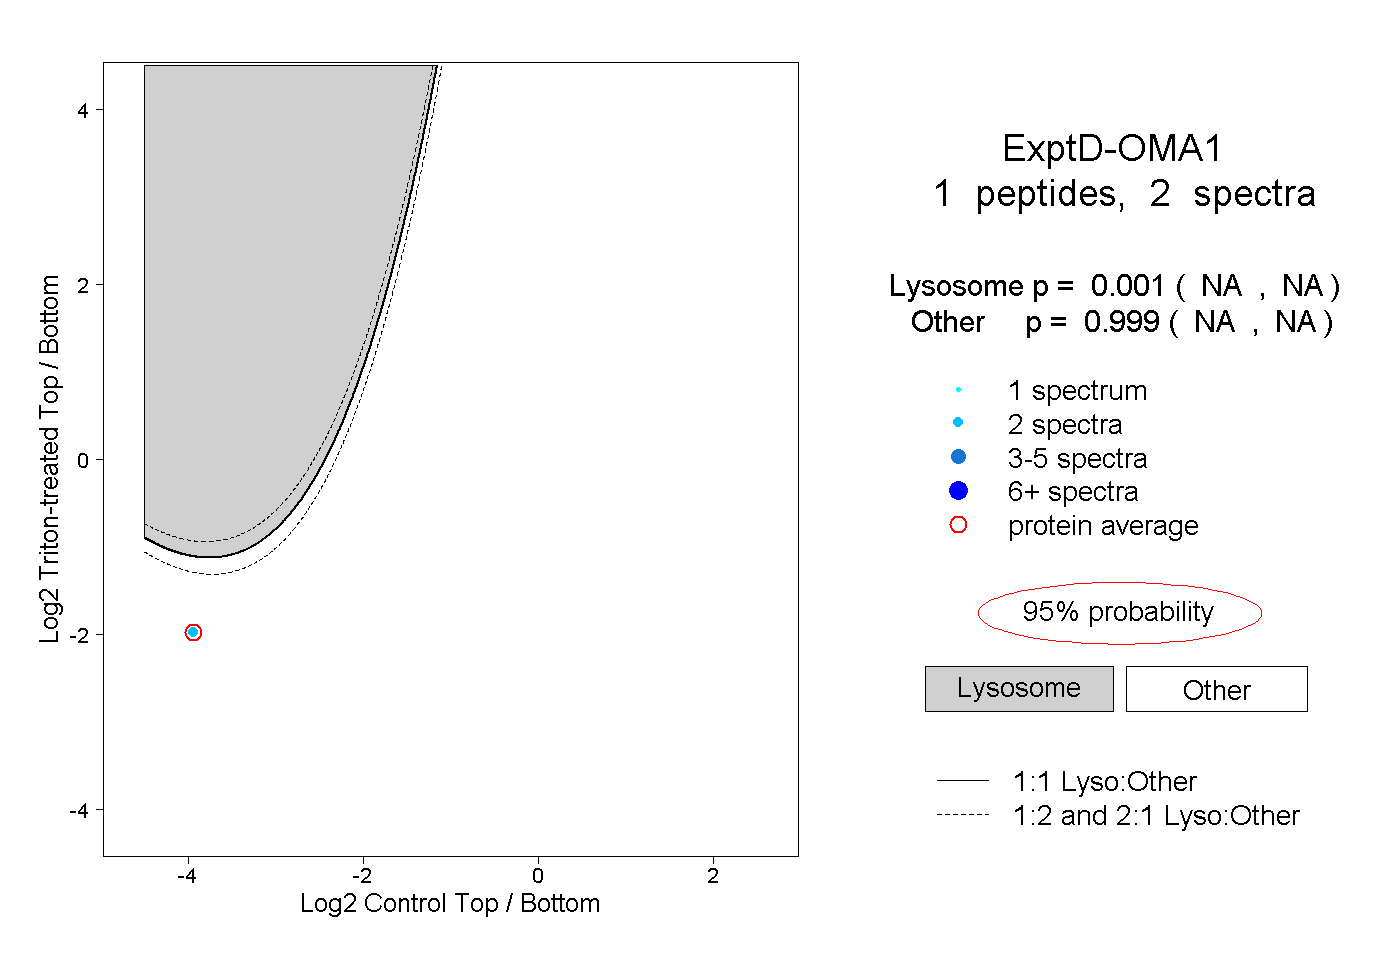
NA | NA
NA | NA