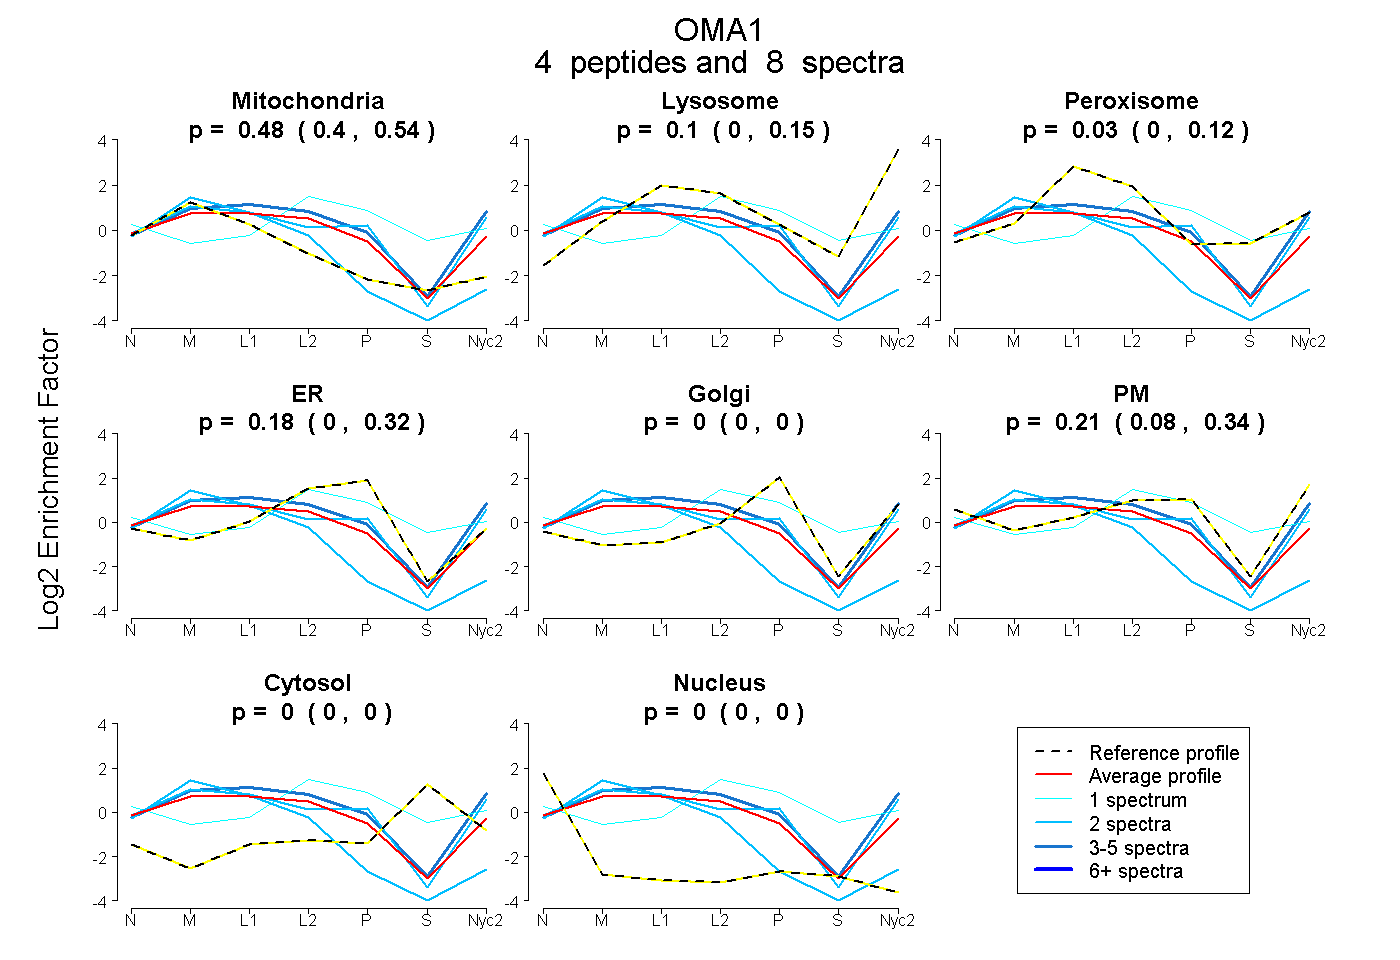
 4
4peptides
spectra
0.400 | 0.543
0.000 | 0.154
0.000 | 0.124
0.000 | 0.316
0.000 | 0.000
0.079 | 0.340
0.000 | 0.000
0.000 | 0.000
| Plot | Mito | Lyso | Perox | ER | Golgi | PM | Cytosol | Nucleus | |||||
| Expt A |
4 peptides |
8 spectra |
|
0.477 0.400 | 0.543 |
0.098 0.000 | 0.154 |
0.031 0.000 | 0.124 |
0.181 0.000 | 0.316 |
0.000 0.000 | 0.000 |
0.213 0.079 | 0.340 |
0.000 0.000 | 0.000 |
0.000 0.000 | 0.000 |
| 2 spectra, LQEYMFDRPYSR | 0.378 | 0.117 | 0.000 | 0.023 | 0.000 | 0.482 | 0.000 | 0.000 | ||
| 2 spectra, LIPQALK | 1.000 | 0.000 | 0.000 | 0.000 | 0.000 | 0.000 | 0.000 | 0.000 | ||
| 3 spectra, DSLAVLGQWIQSK | 0.338 | 0.284 | 0.000 | 0.058 | 0.000 | 0.320 | 0.000 | 0.000 | ||
| 1 spectrum, EVCNCPPLSGPDPR | 0.000 | 0.000 | 0.188 | 0.405 | 0.000 | 0.181 | 0.226 | 0.000 |
| Plot | Mito | Lyso or Perox | ER | Golgi | PM | Cytosol | Nucleus | ||||||
| Expt B |
1 peptide |
1 spectrum |
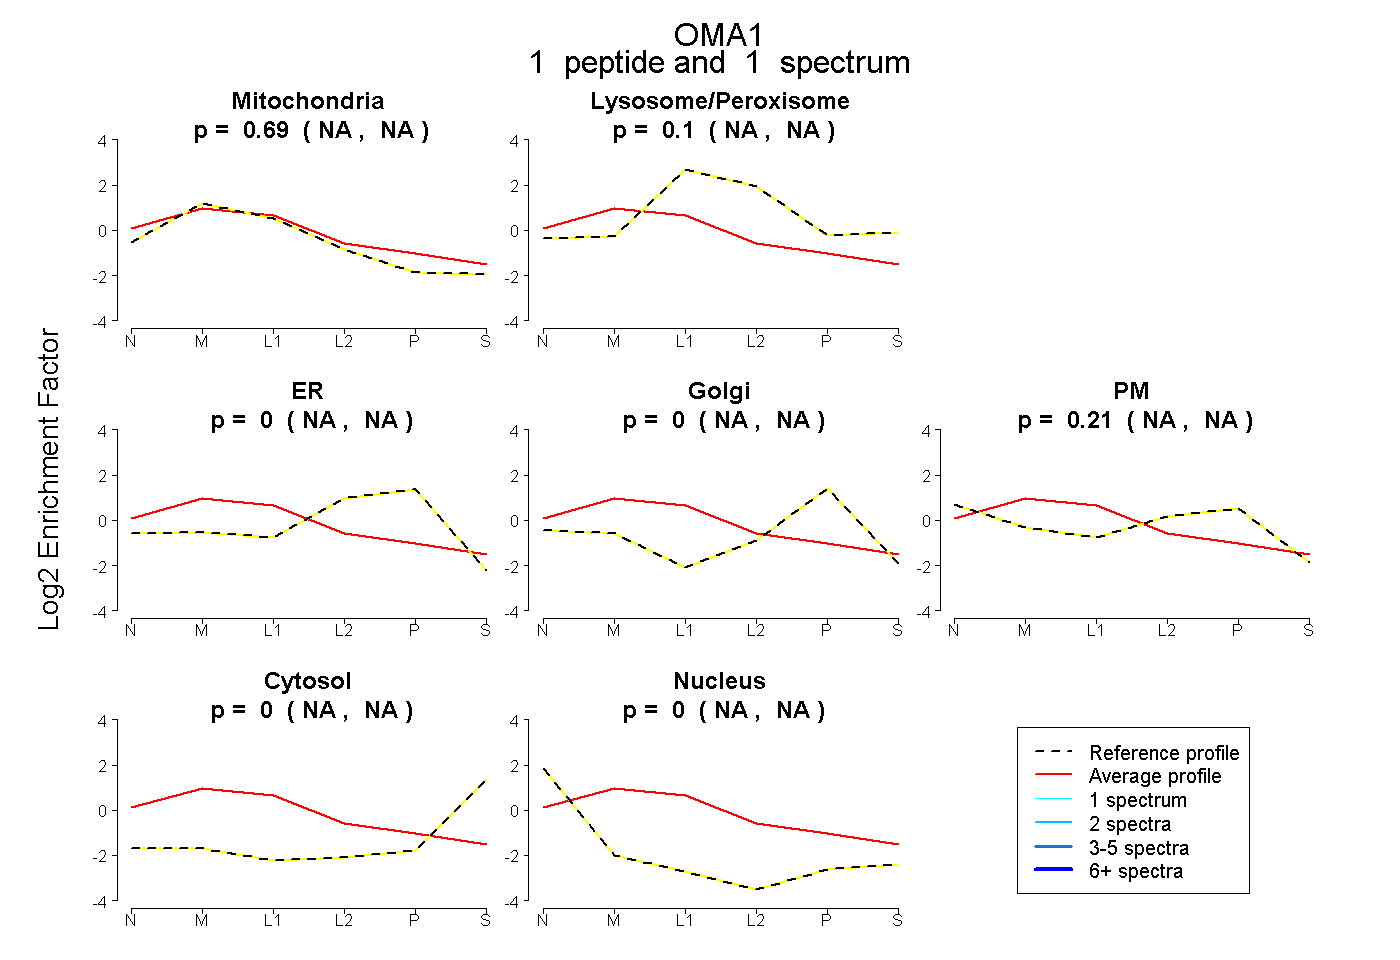 |
0.686 NA | NA |
0.103 NA | NA |
0.000 NA | NA |
0.000 NA | NA |
0.210 NA | NA |
0.000 NA | NA |
0.000 NA | NA |
|||
| Plot | Lyso | Other | |||||||||||
| Expt C |
7 peptides |
39 spectra |
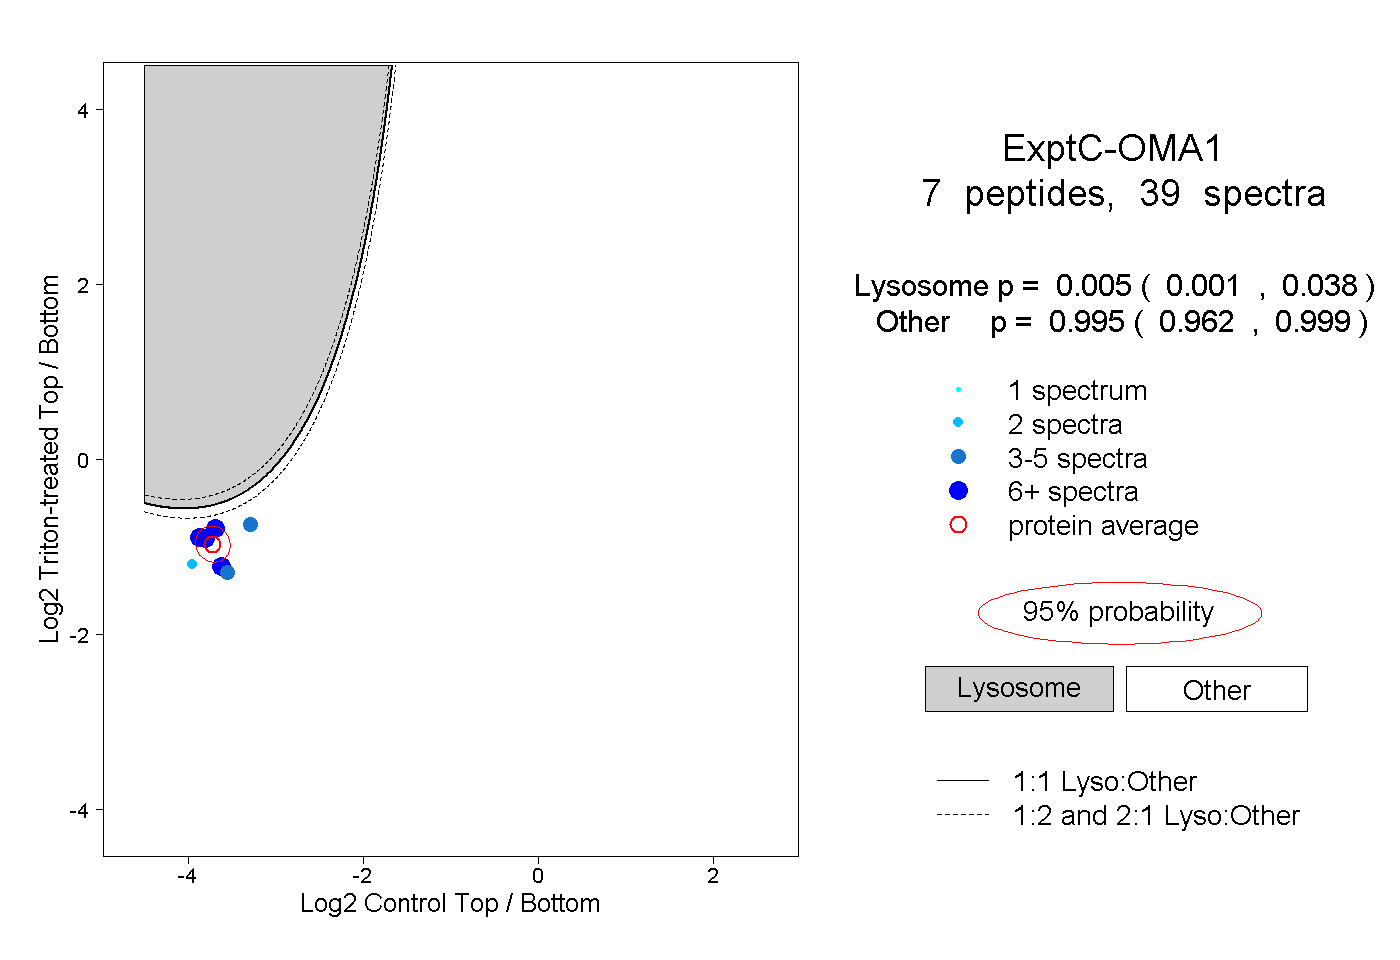 |
0.005 0.001 | 0.038 |
0.995 0.962 | 0.999 |
||||||||
| Plot | Lyso | Other | |||||||||||
| Expt D |
1 peptide |
2 spectra |
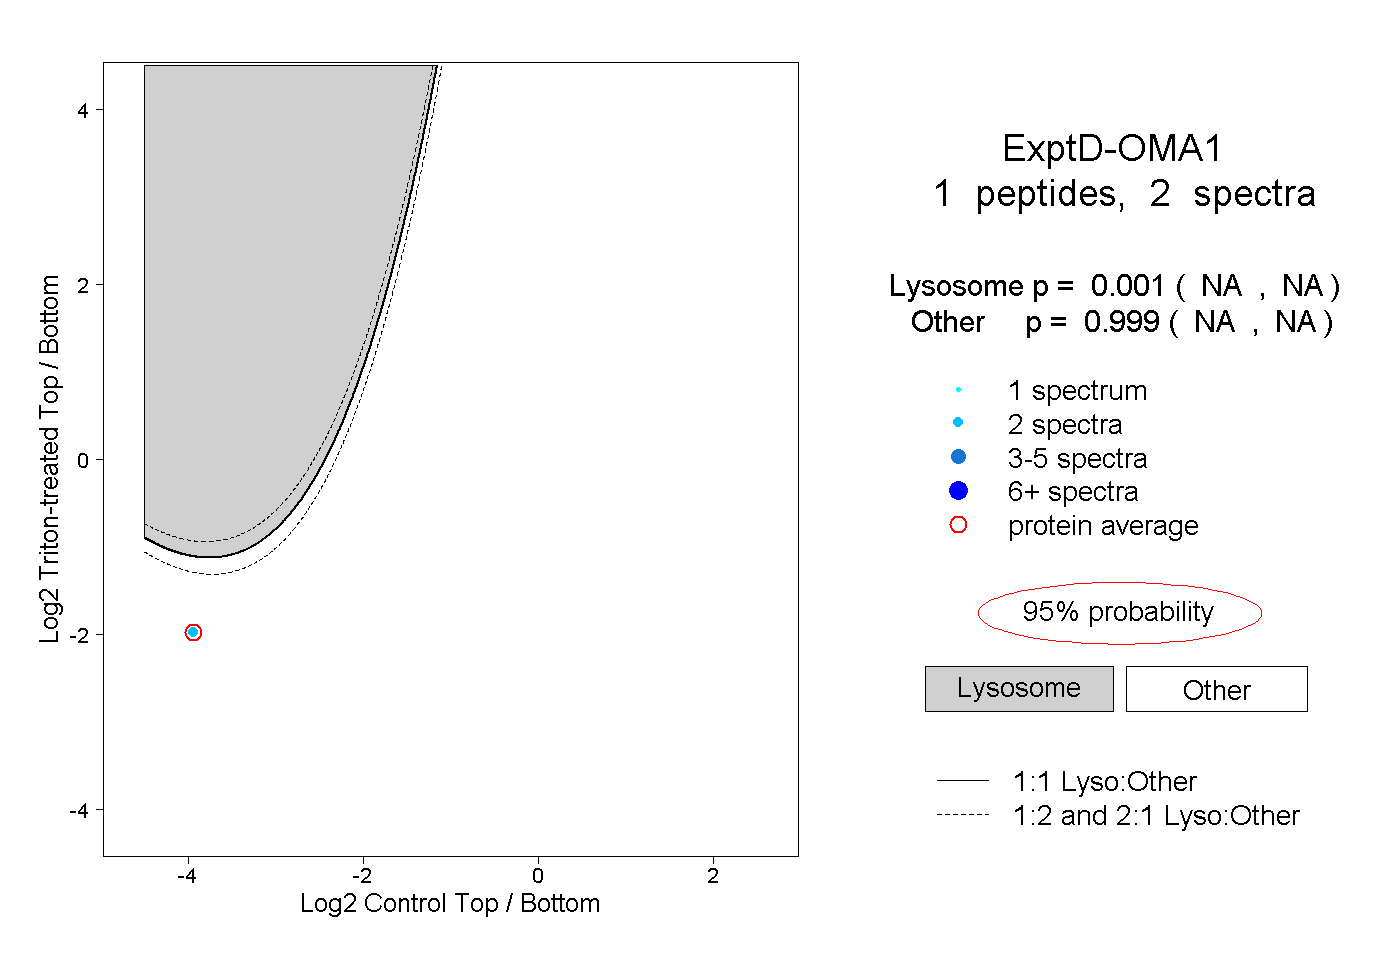 |
0.001 NA | NA |
0.999 NA | NA |