11
11peptides
spectra
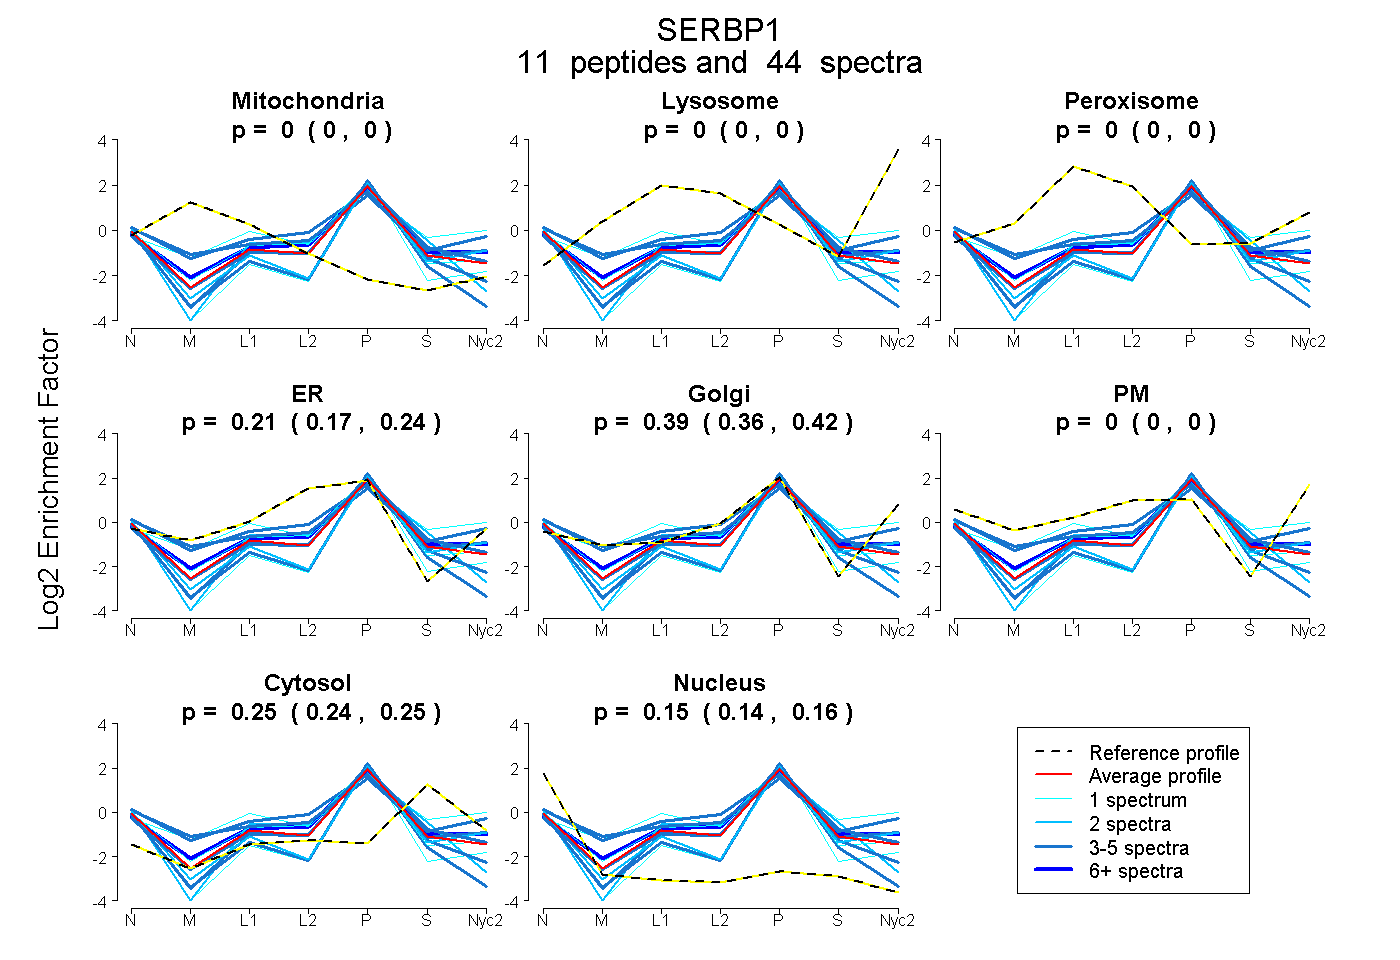
0.000 | 0.000
0.000 | 0.000
0.000 | 0.000
0.175 | 0.236
0.355 | 0.424
0.000 | 0.000
0.238 | 0.253
0.145 | 0.161
5peptides
spectra
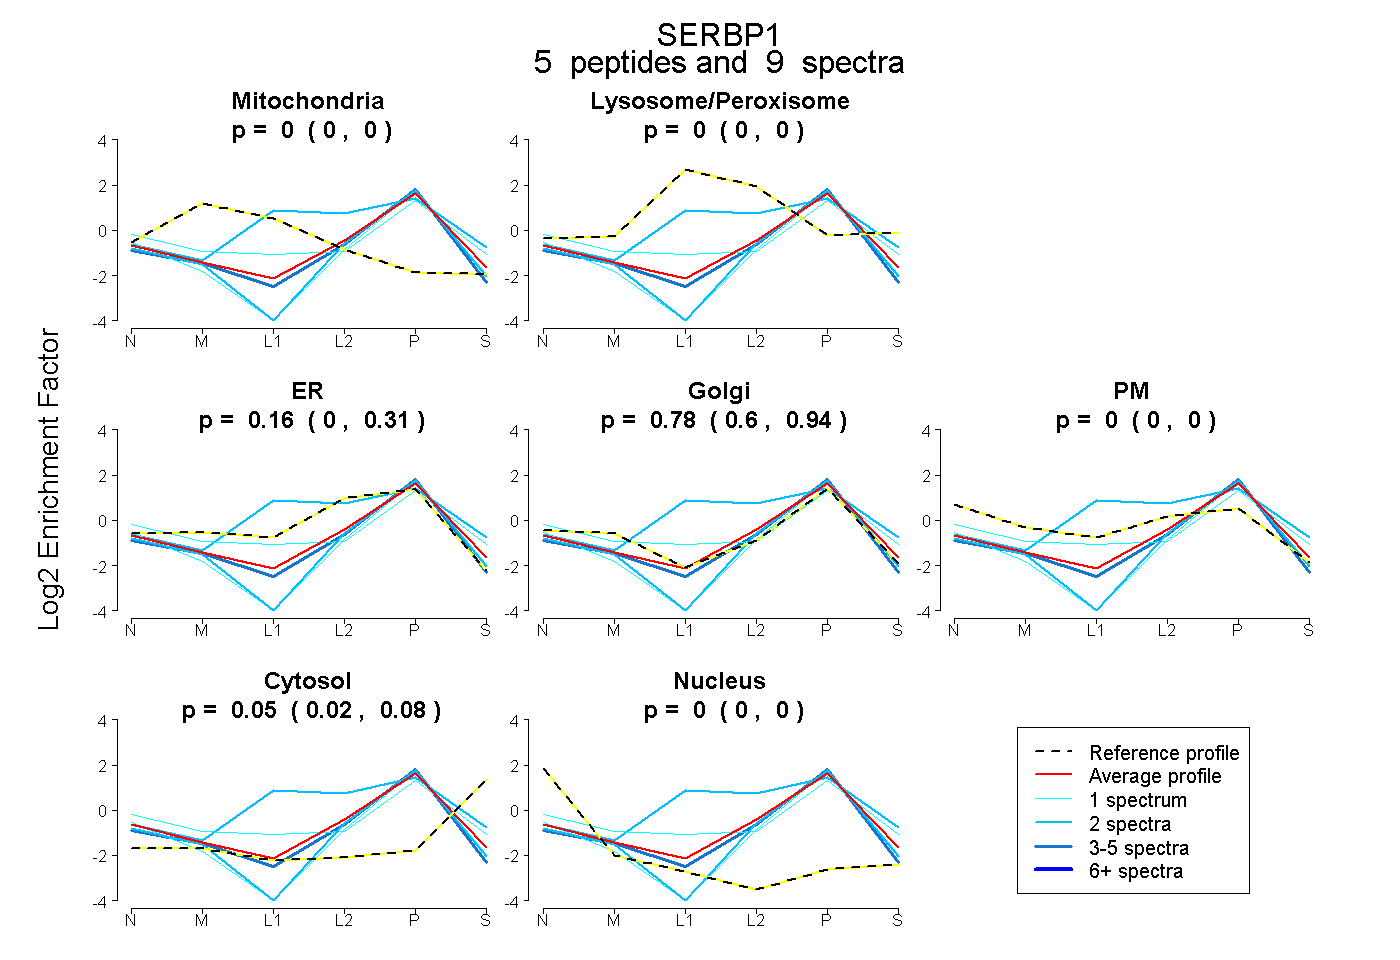
0.000 | 0.000
0.000 | 0.000
0.000 | 0.306
0.596 | 0.942
0.000 | 0.000
0.023 | 0.082
0.000 | 0.000