 11
11peptides
spectra
0.000 | 0.000
0.000 | 0.000
0.000 | 0.000
0.175 | 0.236
0.355 | 0.424
0.000 | 0.000
0.238 | 0.253
0.145 | 0.161
| Plot | Mito | Lyso | Perox | ER | Golgi | PM | Cytosol | Nucleus | |||||
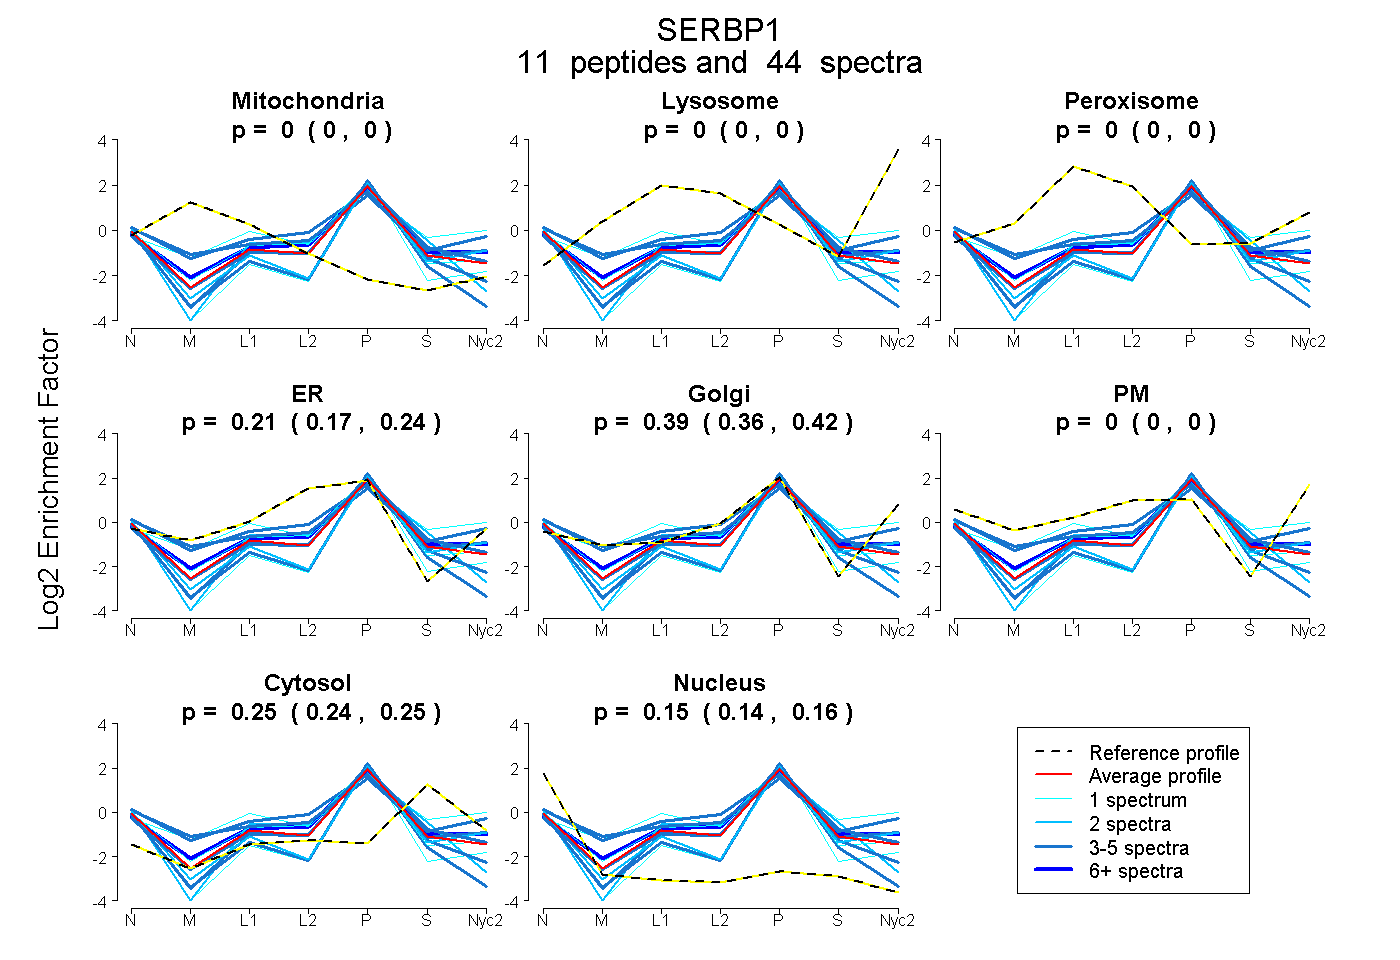
| Expt A |
11 peptides |
44 spectra |
|
0.000 0.000 | 0.000 |
0.000 0.000 | 0.000 |
0.000 0.000 | 0.000 |
0.207 0.175 | 0.236 |
0.393 0.355 | 0.424 |
0.000 0.000 | 0.000 |
0.246 0.238 | 0.253 |
0.153 0.145 | 0.161 |
| 18 spectra, EMTLDEWK | 0.000 | 0.000 | 0.000 | 0.243 | 0.410 | 0.000 | 0.279 | 0.068 | ||
| 5 spectra, PGHLQEGFGCVVTNR | 0.000 | 0.000 | 0.030 | 0.162 | 0.531 | 0.000 | 0.249 | 0.027 | ||
| 3 spectra, GFVLHK | 0.000 | 0.000 | 0.000 | 0.167 | 0.284 | 0.000 | 0.137 | 0.412 | ||
| 5 spectra, VEFNIR | 0.000 | 0.000 | 0.000 | 0.151 | 0.426 | 0.000 | 0.319 | 0.104 | ||
| 2 spectra, SAAQAAAQTNSNAAGK | 0.000 | 0.000 | 0.000 | 0.000 | 0.609 | 0.000 | 0.187 | 0.205 | ||
| 1 spectrum, EAGGGGVGGPGAK | 0.000 | 0.000 | 0.000 | 0.000 | 0.593 | 0.000 | 0.036 | 0.371 | ||
| 1 spectrum, FDQLFDDESDPFEVLK | 0.000 | 0.000 | 0.136 | 0.000 | 0.573 | 0.000 | 0.291 | 0.000 | ||
| 2 spectra, FEKPLEEK | 0.000 | 0.000 | 0.000 | 0.427 | 0.000 | 0.000 | 0.383 | 0.190 | ||
| 1 spectrum, KPNEGADGQWK | 0.000 | 0.000 | 0.000 | 0.355 | 0.338 | 0.000 | 0.166 | 0.142 | ||
| 3 spectra, RPDQQLQGDGK | 0.000 | 0.000 | 0.000 | 0.335 | 0.200 | 0.000 | 0.230 | 0.236 | ||
| 3 spectra, GDGFDSR | 0.000 | 0.000 | 0.000 | 0.520 | 0.198 | 0.000 | 0.219 | 0.064 |
| Plot | Mito | Lyso or Perox | ER | Golgi | PM | Cytosol | Nucleus | ||||||
| Expt B |
5 peptides |
9 spectra |
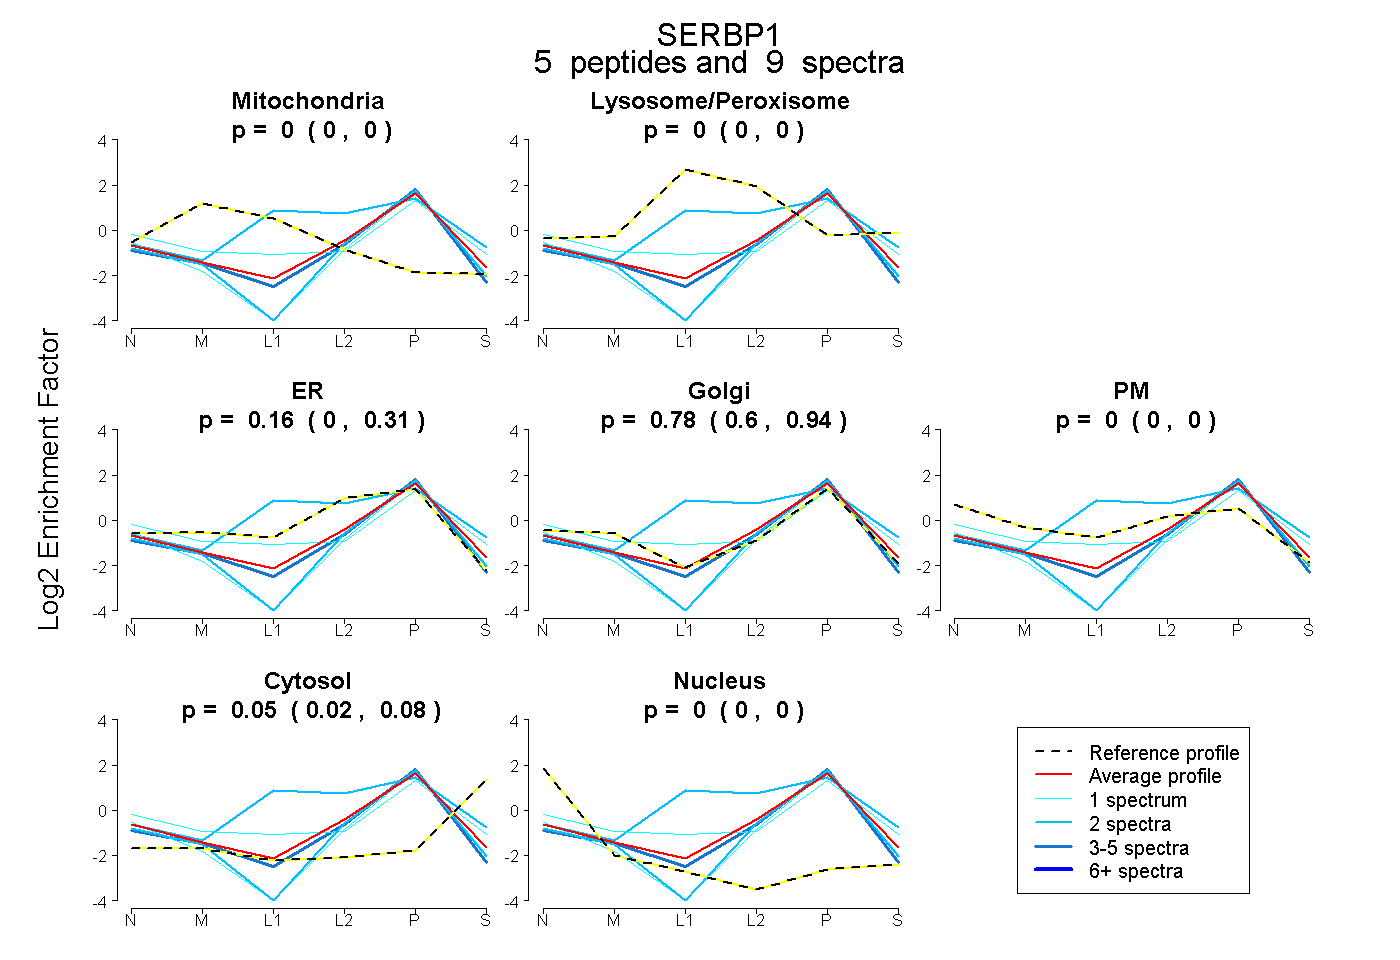 |
0.000 0.000 | 0.000 |
0.000 0.000 | 0.000 |
0.163 0.000 | 0.306 |
0.782 0.596 | 0.942 |
0.000 0.000 | 0.000 |
0.055 0.023 | 0.082 |
0.000 0.000 | 0.000 |
|||
| Plot | Lyso | Other | |||||||||||
| Expt C |
8 peptides |
28 spectra |
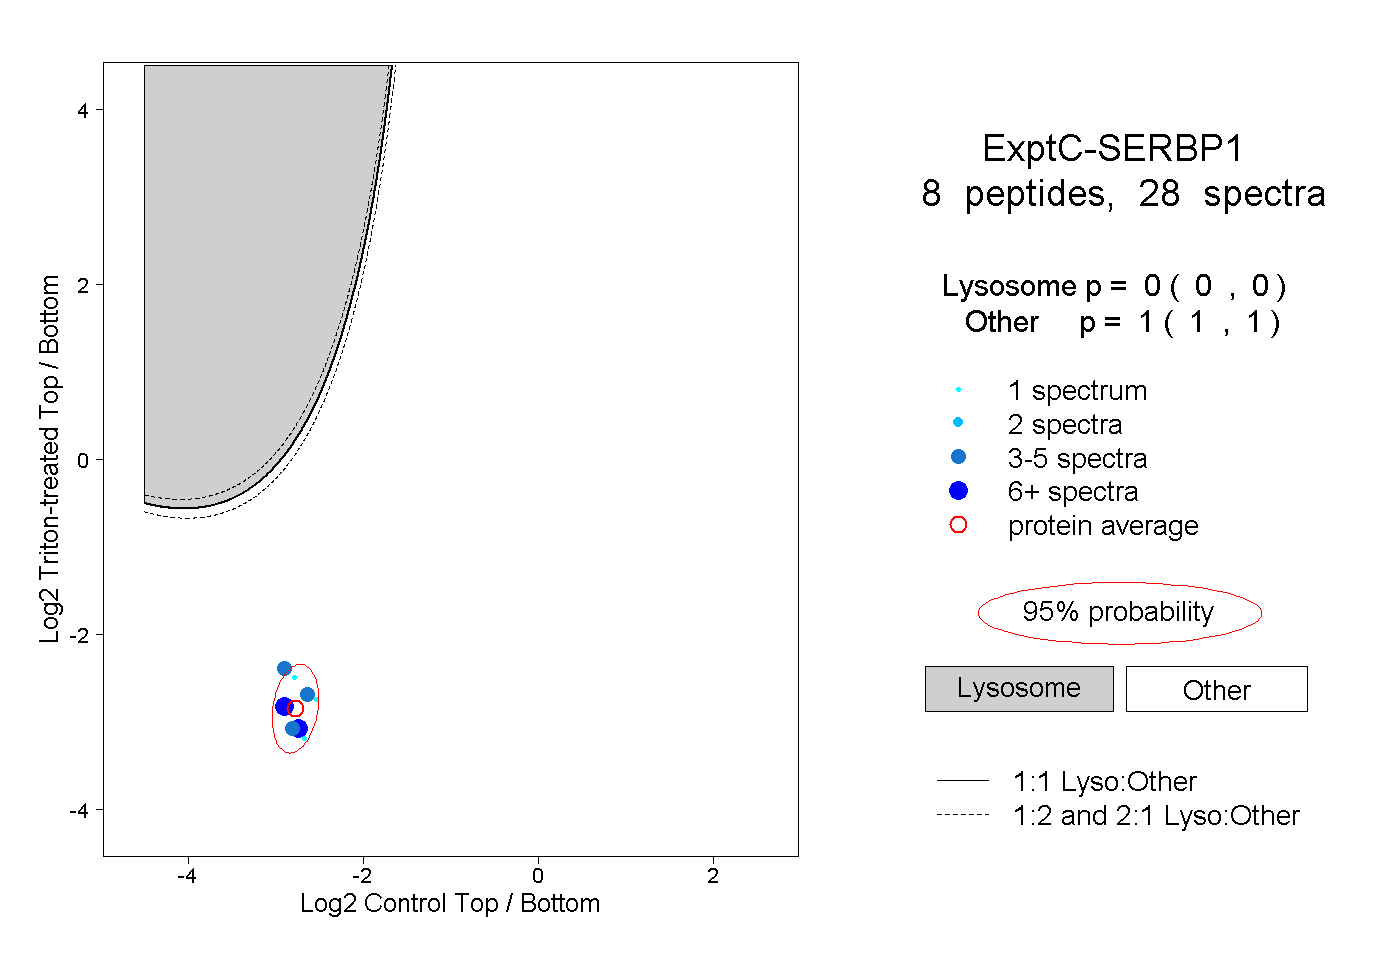 |
0.000 0.000 | 0.000 |
1.000 1.000 | 1.000 |
||||||||
| Plot | Lyso | Other | |||||||||||
| Expt D |
2 peptides |
2 spectra |
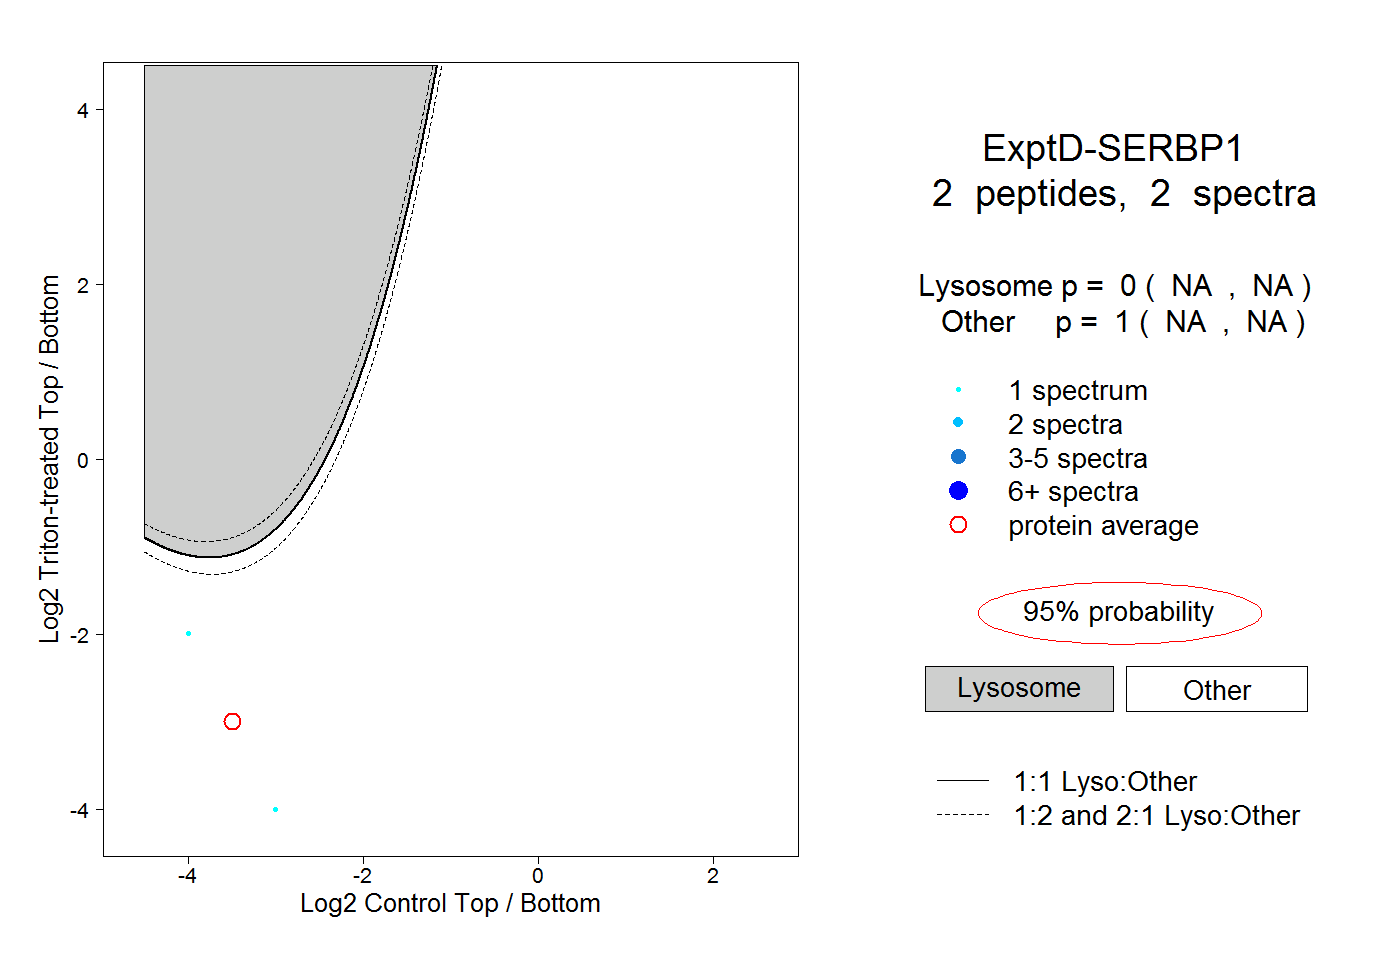 |
0.000 NA | NA |
1.000 NA | NA |